


Introduction
In Easy8, dashboard widget filters help personalize and control what data is shown in widgets. When setting up a dashboard, you can select from many widget types—some of which include filter options that allow you to tailor the displayed data to your needs. This article explains what these filters are, where to find them, and how they are used in the current version of Easy8.
Target Audience
- User
- Administrator
What Are Dashboard Widget Filters?
Definition
Dashboard widget filters are filter settings available inside some widgets that allow users to narrow down the data shown. These filters are used during dashboard personalization and can show only the most relevant data—such as specific users, time periods, activities, or statuses.
Supported Widgets
Not all widgets have filter options. Based on the current version of Easy8, here are some commonly used widgets that include filtering features:
- Attendance – filter by user, team, or time period
- Dynamic filters – interactive filtering for tasks, time, or projects directly in the dashboard
- Saved filters list – allows access to saved public and private filters from the dashboard
- Charts (Bar Chart, Line Chart, Pie Chart, Timeseries) – often configured using saved filters
- Spent time, Spent time calendar, Who’s doing what – filter time tracking data by user or project
- Resource management & reports – filter by team, project, or date
- User utilization & group utilization – focus on selected teams or individuals
- Kanban/Scrum boards – may reflect filtered task statuses or project stages
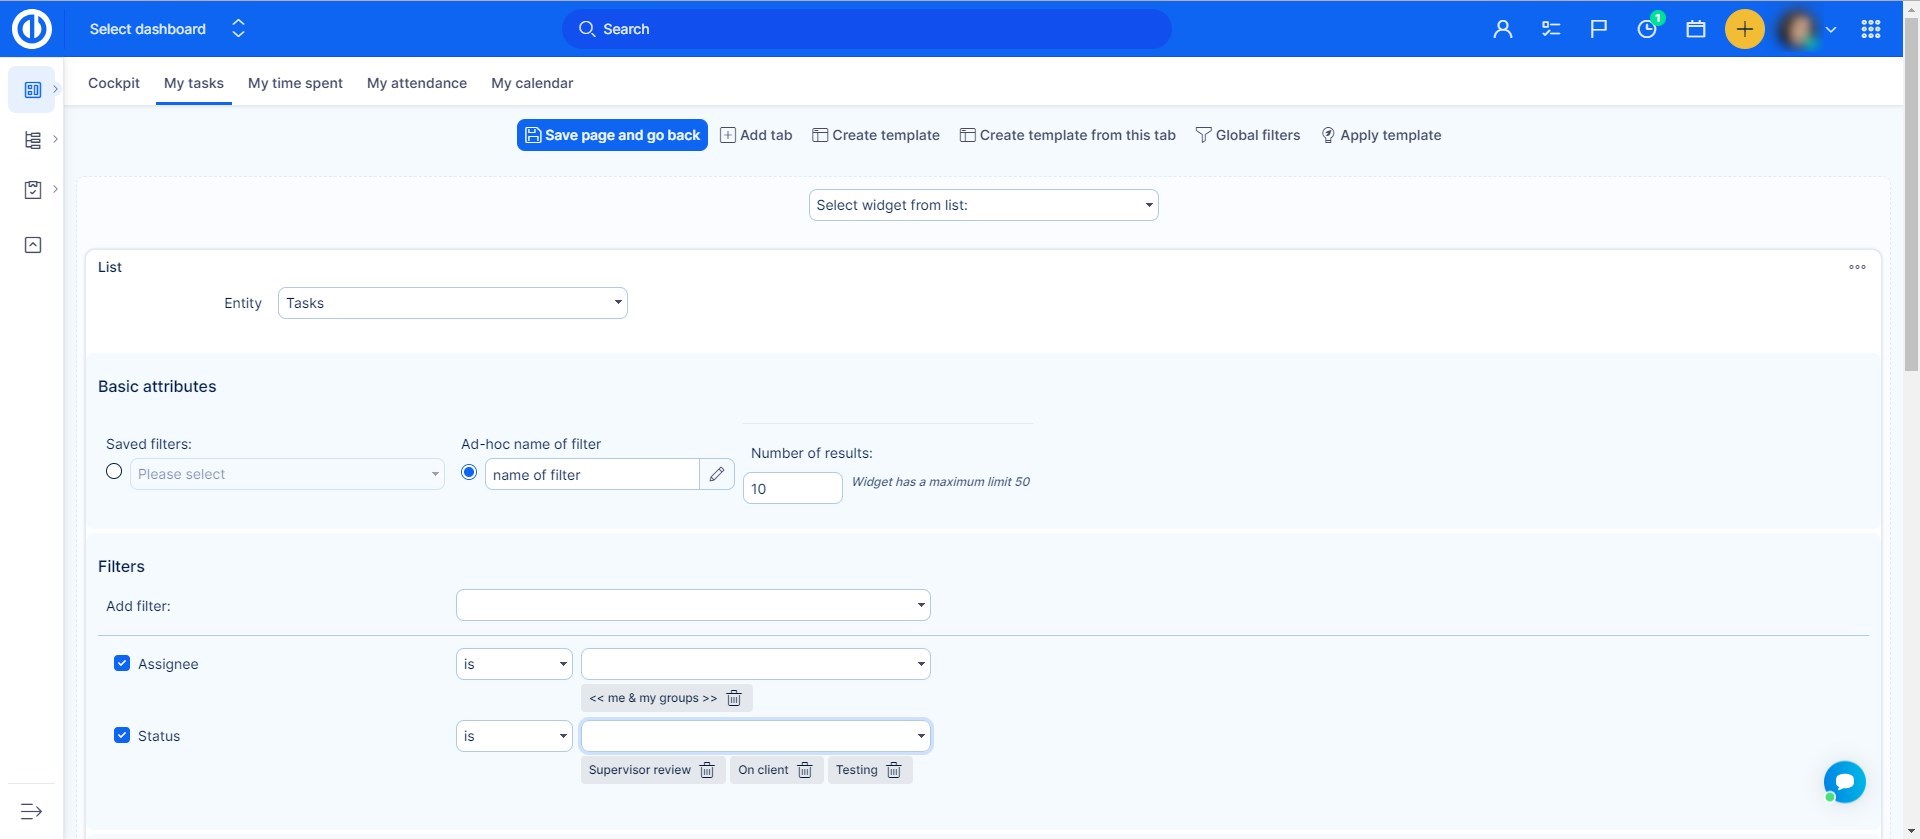
How It Works
- Click Customise on your dashboard
- Select a widget from the list (e.g. Bar Chart, Dynamic filters)
- Configure its filter options, such as user, date range, or saved filter
- Click Save page and go back to see the filtered data in the widget
Each widget may offer different filters depending on the data it displays. For example:
- Attendance lets you focus on a specific group of users
- Spent time can show hours tracked for one or multiple projects
- Charts use saved filters to define the data set being visualized
Example Use Cases
- A team lead adds a User utilization widget filtered by their department
- A project manager uses a Bar Chart based on a saved filter for tasks due this week
- An HR user includes an Attendance widget filtered by their team’s presence this month
- A developer adds a Dynamic filters widget to track their current sprint work
Conclusion
Dashboard widget filters in Easy8 help users focus on the data that matters most. Whether you're visualizing work, tracking time, or managing resources, using filters in widgets allows for better clarity and efficiency in your personalized dashboards.

