Documentation of Resource dashboard
Resource Dashboard is a complement to the Resource management plugin. It is a set of dashboards that brings an ultimate visual overview of all your resources on a one-page dashboard. So you need no more than just one look at this dashboard in order to get an instant insight into your KPI's and resources.
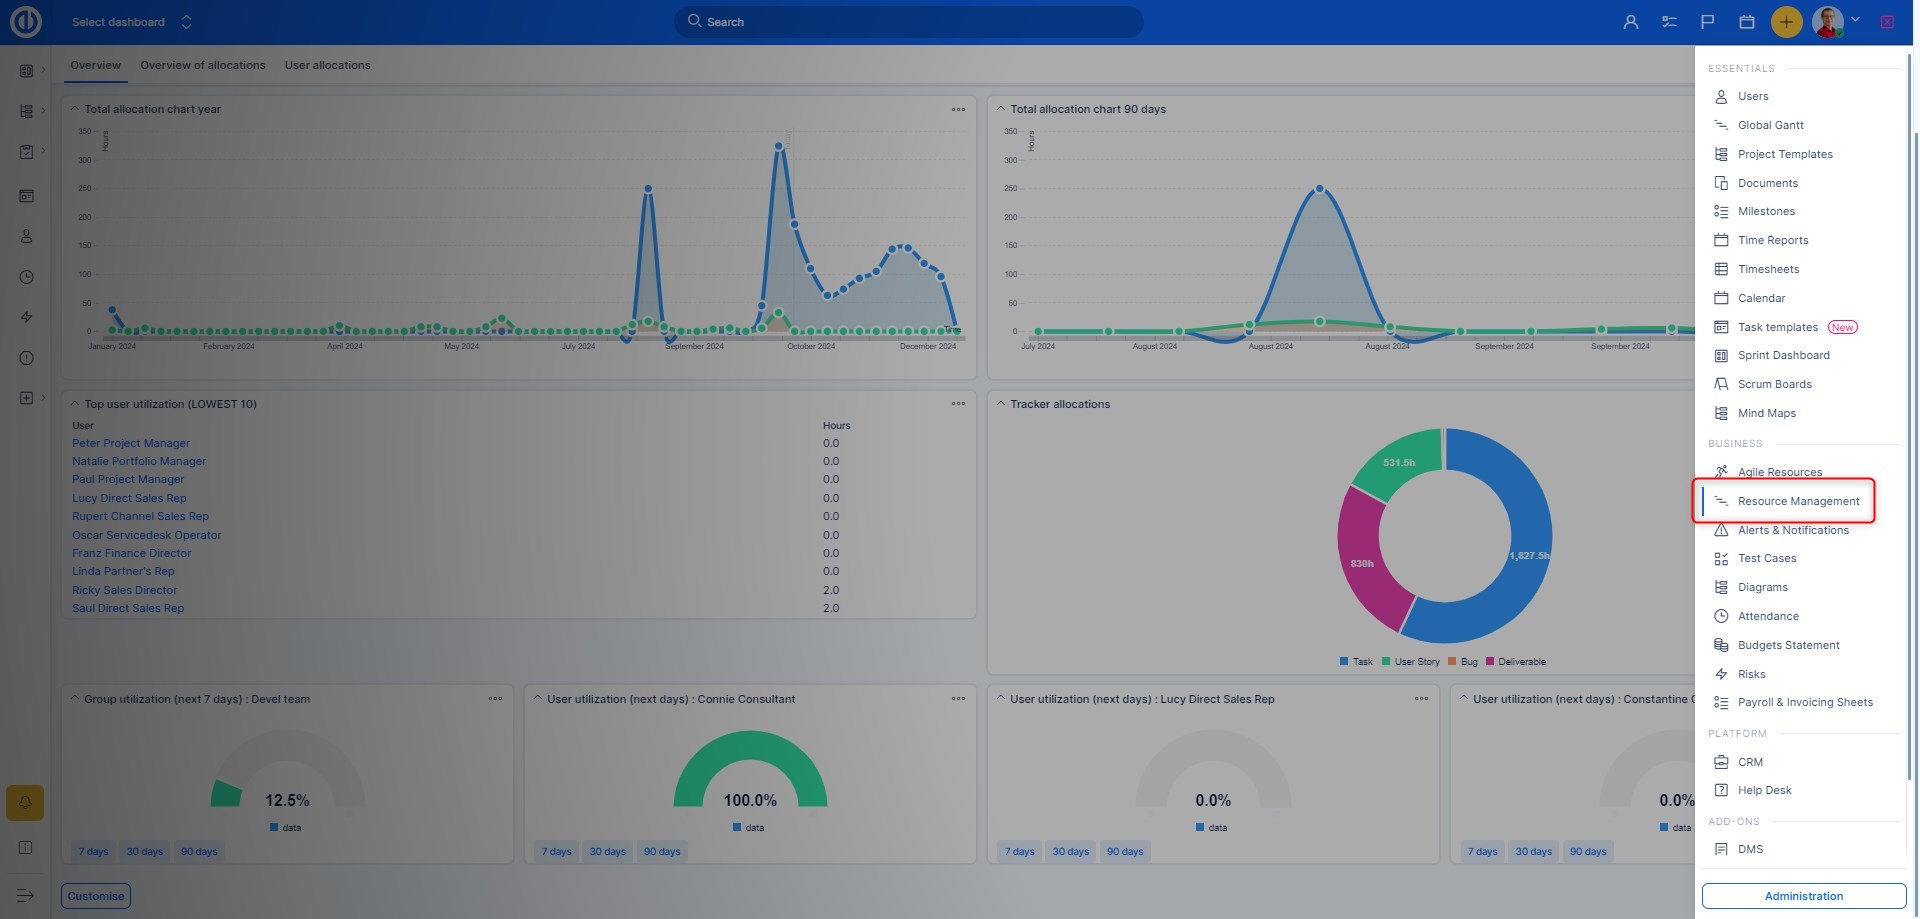
How to access the Dashboards
You can find it in Globa menu as shown below. Please note this is a global-level functionality only so you cannot find it on particular projects.
Easily customizable
In principle, the resource dashboard can be customized in the same manner as My Dashboard or a Project dashboard. The main difference is in the availability of widgets you can select from and put them on the page. Among the standard widgets that you can add into Resource Dashboard as well as on any other Dashboards, there are several additional widgets specifically customized for the purpose of showing resource allocations as listed below.
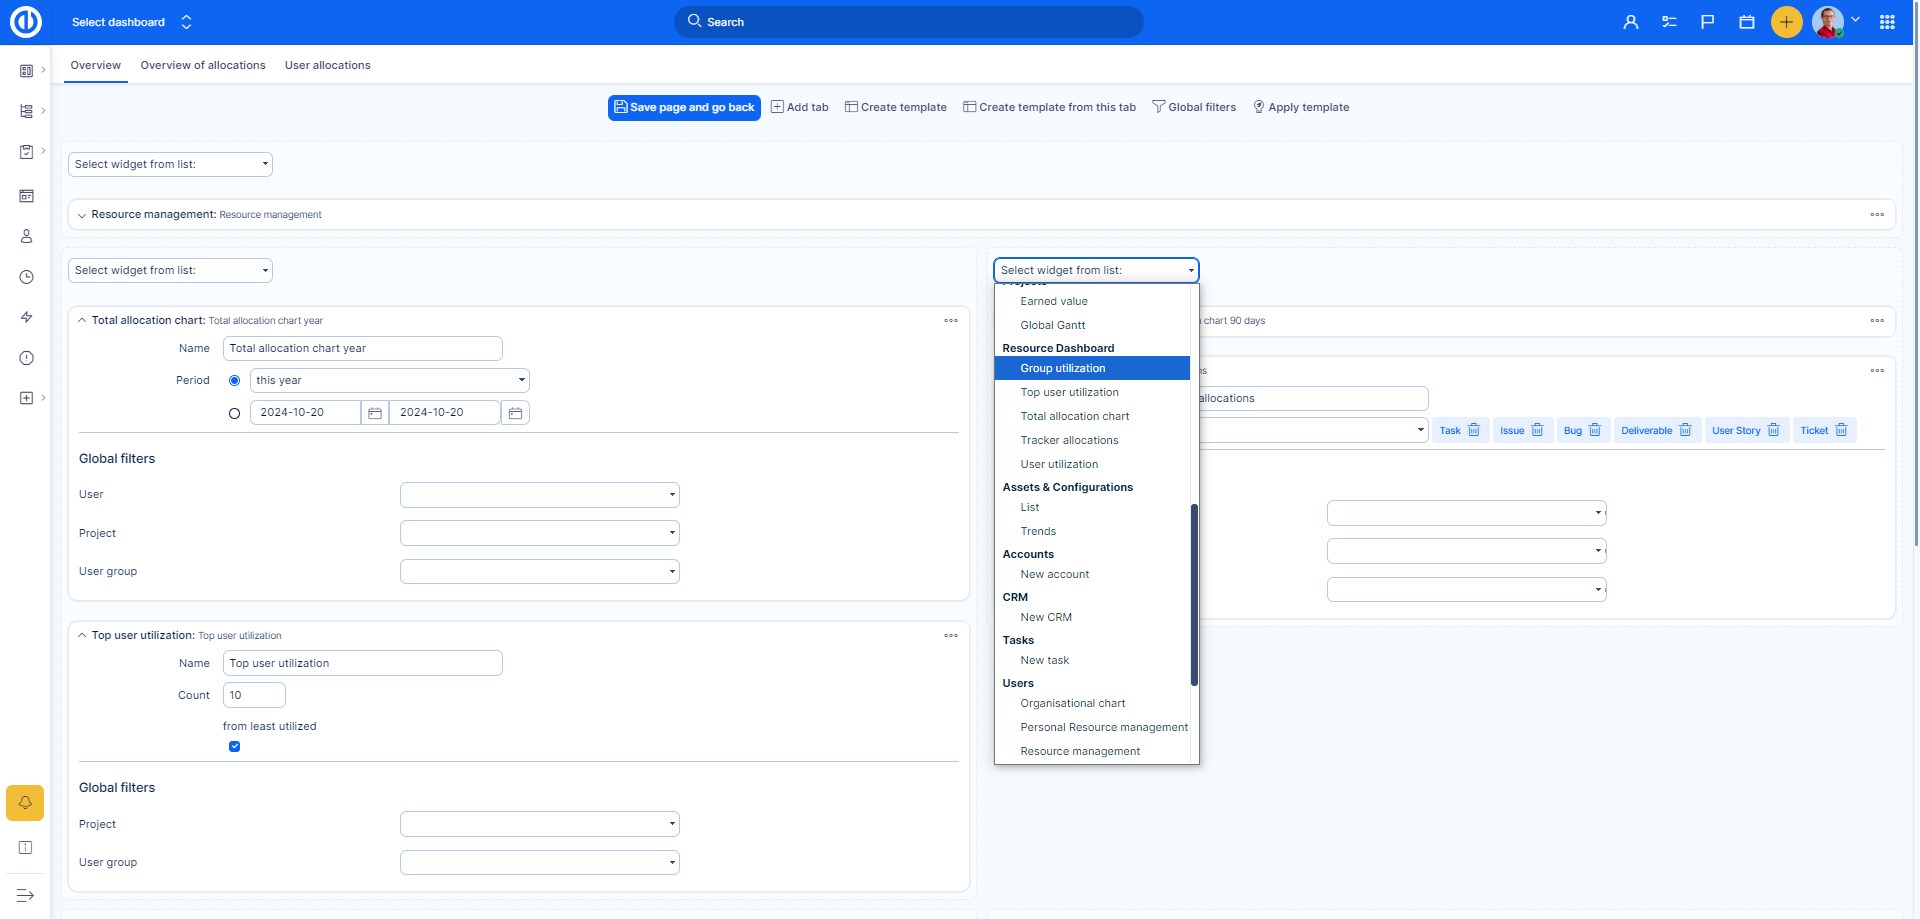
Many types of interactive visualization
Select from various available types of data representation such as graphs, charts, gauges and pipelines. Everything may be easily and quickly configured in widget settings.
Tracker allocations
Tracker allocations show how much time is allocated for each type of a task tracker. It might look like this.
![]()
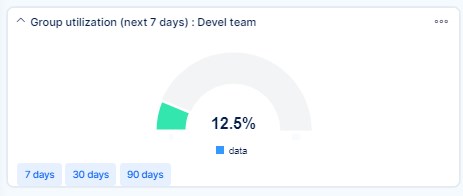
Group utilization
Group utilization shows a work utilization of a selected group of users. Here is an example.
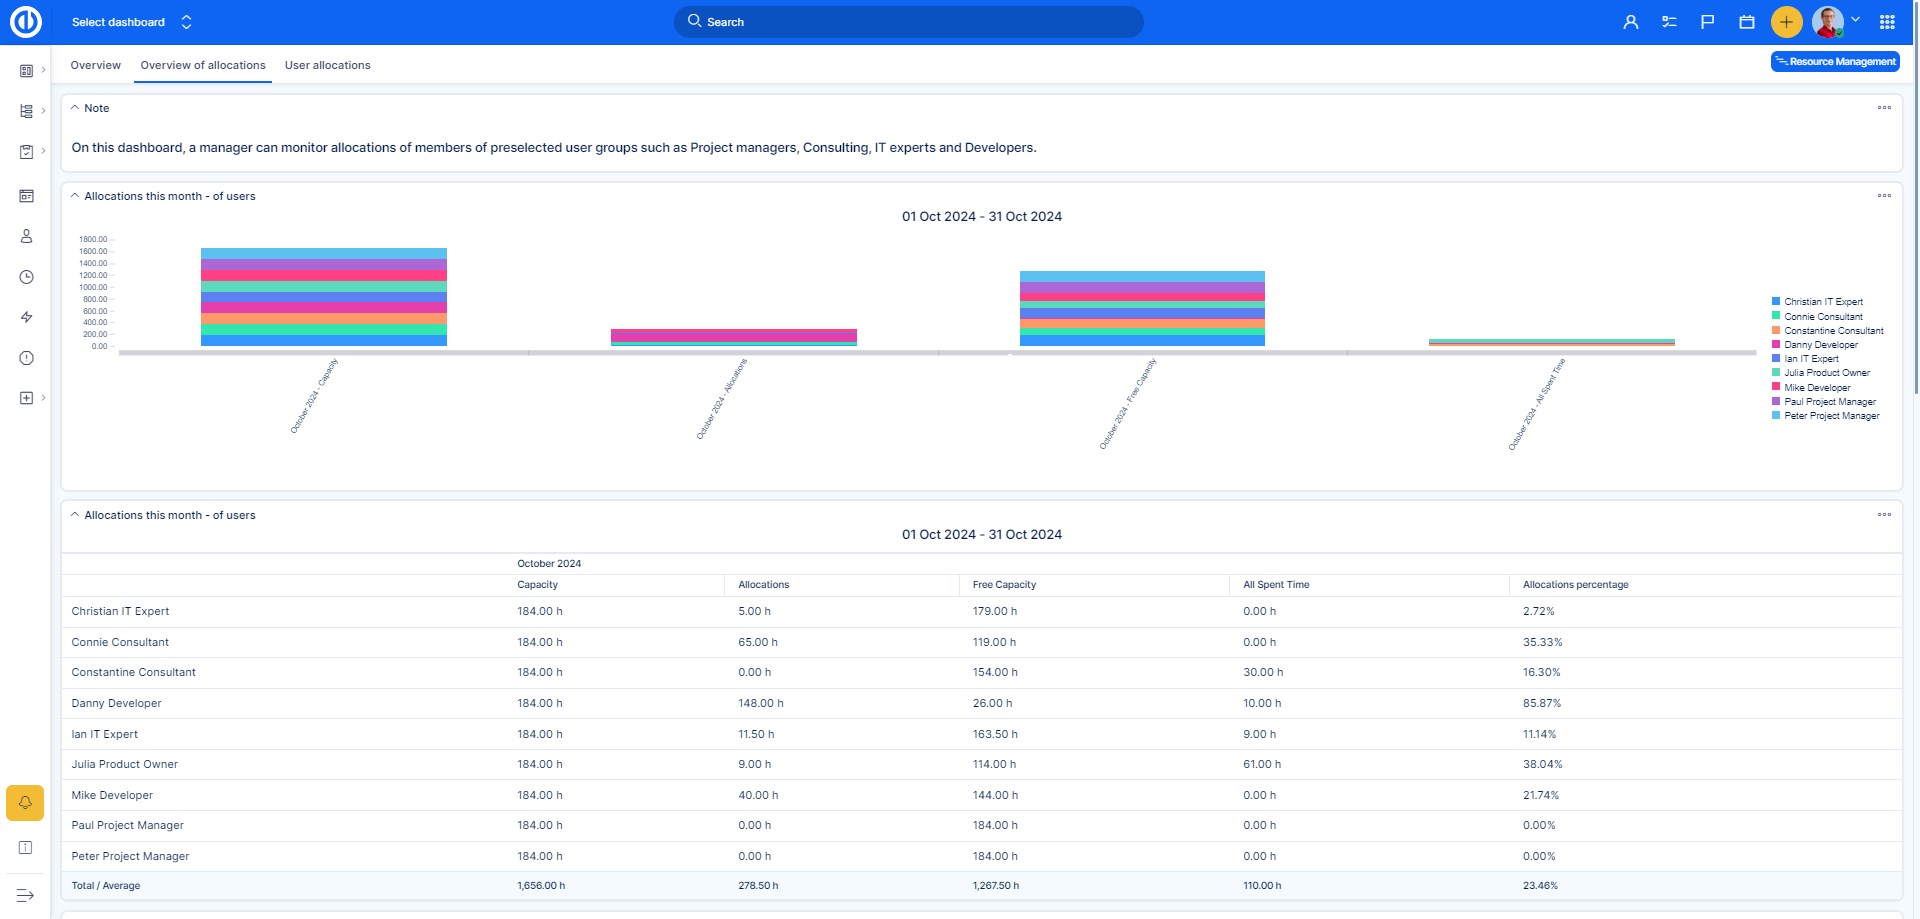
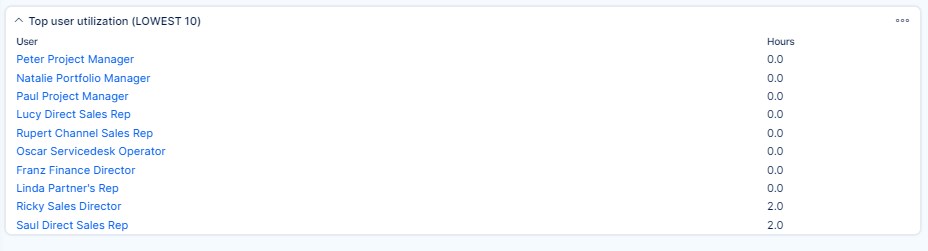
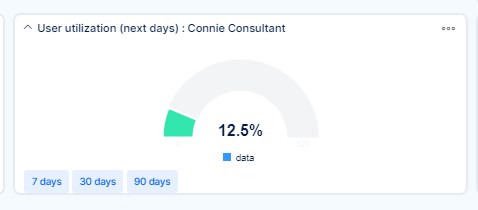
Top user utilization / User utilization
While Top user utilization shows a list with specified number of most utilized users, a common User utilization shows a total allocation per selected user as illustrated below.
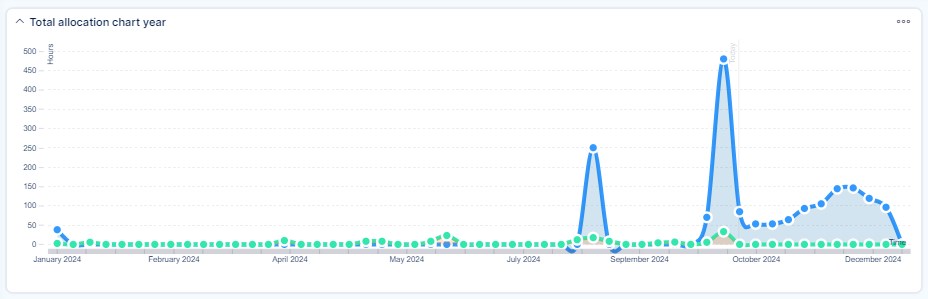
Total allocation chart
Total allocation chart shows a total allocation overview as the proportion of spent time and estimated time per all resources in a single chart. This may look like this.