


WorkOps in practice: Reporting that drives decisions
Good decisions start with good reporting. Before companies automate workflows, connect teams, or introduce AI into operations, they first need one thing: clear visibility.
They need to know what is happening across projects, resources, budgets, deadlines, and customer delivery. This is where WorkOps begins.
Reporting is not just about creating management updates. It is about building a shared operational view of work across the company, so teams can react faster, spot risks earlier, and make decisions based on facts instead of assumptions.
In Easy8 (WorkOps), we work with three layers:
- Reporting starts with dashboards: role-based views that help individuals, project managers, and customers work with the same source of truth.
- The next step is smarter reporting with AI Project Status, where different status updates are done automatically.
- And finally, for larger organisations, reporting often goes beyond Easy8 itself. Companies need data from multiple systems, custom executive reports, and automated outputs in formats leadership actually uses. This is where reporting becomes connected through APIs, n8n, and external BI tools.
Together, these three layers create practical WorkOps reporting:
- Dashboards for visibility,
- AI for automated status reporting,
- Integrations for enterprise-level reporting across systems.

Dashboards in Easy8
Easy8 dashboards support a first phase in WorkOps by bringing project data, KPIs, time, risks, and operational metrics into one visual layer that can be tailored by role, project, or business need. Easy8 positions dashboards as a way to increase visibility, simplify reporting, improve decision-making, and create role-specific views without losing shared context across the company.
1. Personal reporting dashboard for daily execution
Individuals often waste time switching between task lists, timesheets, and status updates.
A personal dashboard can combine open tasks and priorities, due dates, logged time or attendance, a simple KPI widget such as completion rate or billable utilisation.
Why it matters for WorkOps:
This turns reporting into part of the daily workflow instead of a separate admin task. This is the first reporting layer: each person sees their own work clearly, updates it continuously, and generates cleaner data for the rest of the organisation.
2. Project manager dashboard for scope, time and, budget control
Project managers do not need more data. They need a fast way to spot whether a project is slipping in time, expanding in scope, or drifting in budget.
Build a project dashboard with:
- a timeline or milestone view,
- trend widgets for estimates vs. spent time,
- budget widgets for planned vs. actual costs or income,
- a filtered project overview for switching between multiple projects.
The clue is not to overload the dashboard, but to visualise the few metrics that matter most for decisions. Dashboards work best when they aggregate key data into one understandable view and let users react quickly to issues or bottlenecks.
Why it matters for WorkOps:
This is reporting as operational control. Instead of preparing status updates manually, PMs can monitor project health continuously and act earlier.
3. Role-specific reporting for time and resource visibility
Different teams report differently. Developers, service teams, and contractors do not all need the same dashboard.
Typical use cases:
- IT or engineering teams: embed weekly timesheets directly into the homepage for fast reporting.
- Service teams: use a calendar-based dashboard to log and review time visually on a monthly basis.
- Contractors or externals: use daily reporting views to keep a clean record of hours for invoicing.
Instead of forcing one reporting method on everyone, Easy8 dashboards can reflect the way each role actually works. This aligns with Easy8’s broader dashboard concept: different dashboard types can be adapted to the needs of specific users, projects, or functions.
Why it matters for WorkOps:
WorkOps reporting should not be one-size-fits-all. The point is to create one reporting system with views that fit different roles, while still feeding one shared operating layer.
4. Customer-facing dashboard for transparent reporting and approval
Project reporting often gets stuck in email chains, static status documents, and delayed approvals.
Create a limited customer dashboard showing only the relevant project information, such as:
- timeline progress,
- milestone status,
- selected tasks waiting for review or approval.
A strong use case is that the customer can move a task into an approval status directly in the system. That creates a visible record of approval without relying on separate email confirmation.
This changes reporting from “sending updates” to “sharing live project reality.” It also reduces the ping-pong between the project team and the customer.
Why it matters for WorkOps:
This is where reporting becomes cross-functional. Internal and external stakeholders work from the same source of truth, but with the right access limits.
Dashboards in Easy8 are not just a visual layer. They are a practical entry point into WorkOps. In the first phase, which is Reporting, they help teams turn scattered project, time, financial, and operational data into role-based views that support faster decisions and less manual reporting. Easy8 supports this through personal dashboards, project dashboards, feature dashboards, custom dashboards, and quick navigation between them.
AI Project Status
Project managers spend too much time preparing status updates instead of actually managing projects. Weekly reports, monthly summaries, customer updates, and steering committee overviews often require manually checking completed tasks, delays, priorities, and risks.
AI Project Status in Easy8 solves this by automatically generating structured project reports directly from live project data.
The project manager can define what the report should include:
- completed tasks
- updated tasks
- scheduled tasks
- problematic tasks
Reports can be generated once or scheduled automatically on a weekly, bi-weekly, or monthly basis. The output can then be copied directly into emails, presentations, customer reports, or internal management updates.
Why it matters:
- saves significant time on repetitive reporting
- gives project managers instant visibility into progress and risks
- highlights delayed and problematic tasks automatically
- creates consistent reporting without manual preparation
- helps managers focus on decisions instead of administration
AI Project Status turns reporting from manual documentation into real decision support.
Watch AI Project Status in action
Advanced reporting with n8n
Easy8 dashboards are excellent for operational reporting, but some companies need more advanced reporting scenarios that go beyond standard dashboard views.
This usually happens in two situations:
1. Large-scale reporting across multiple systems
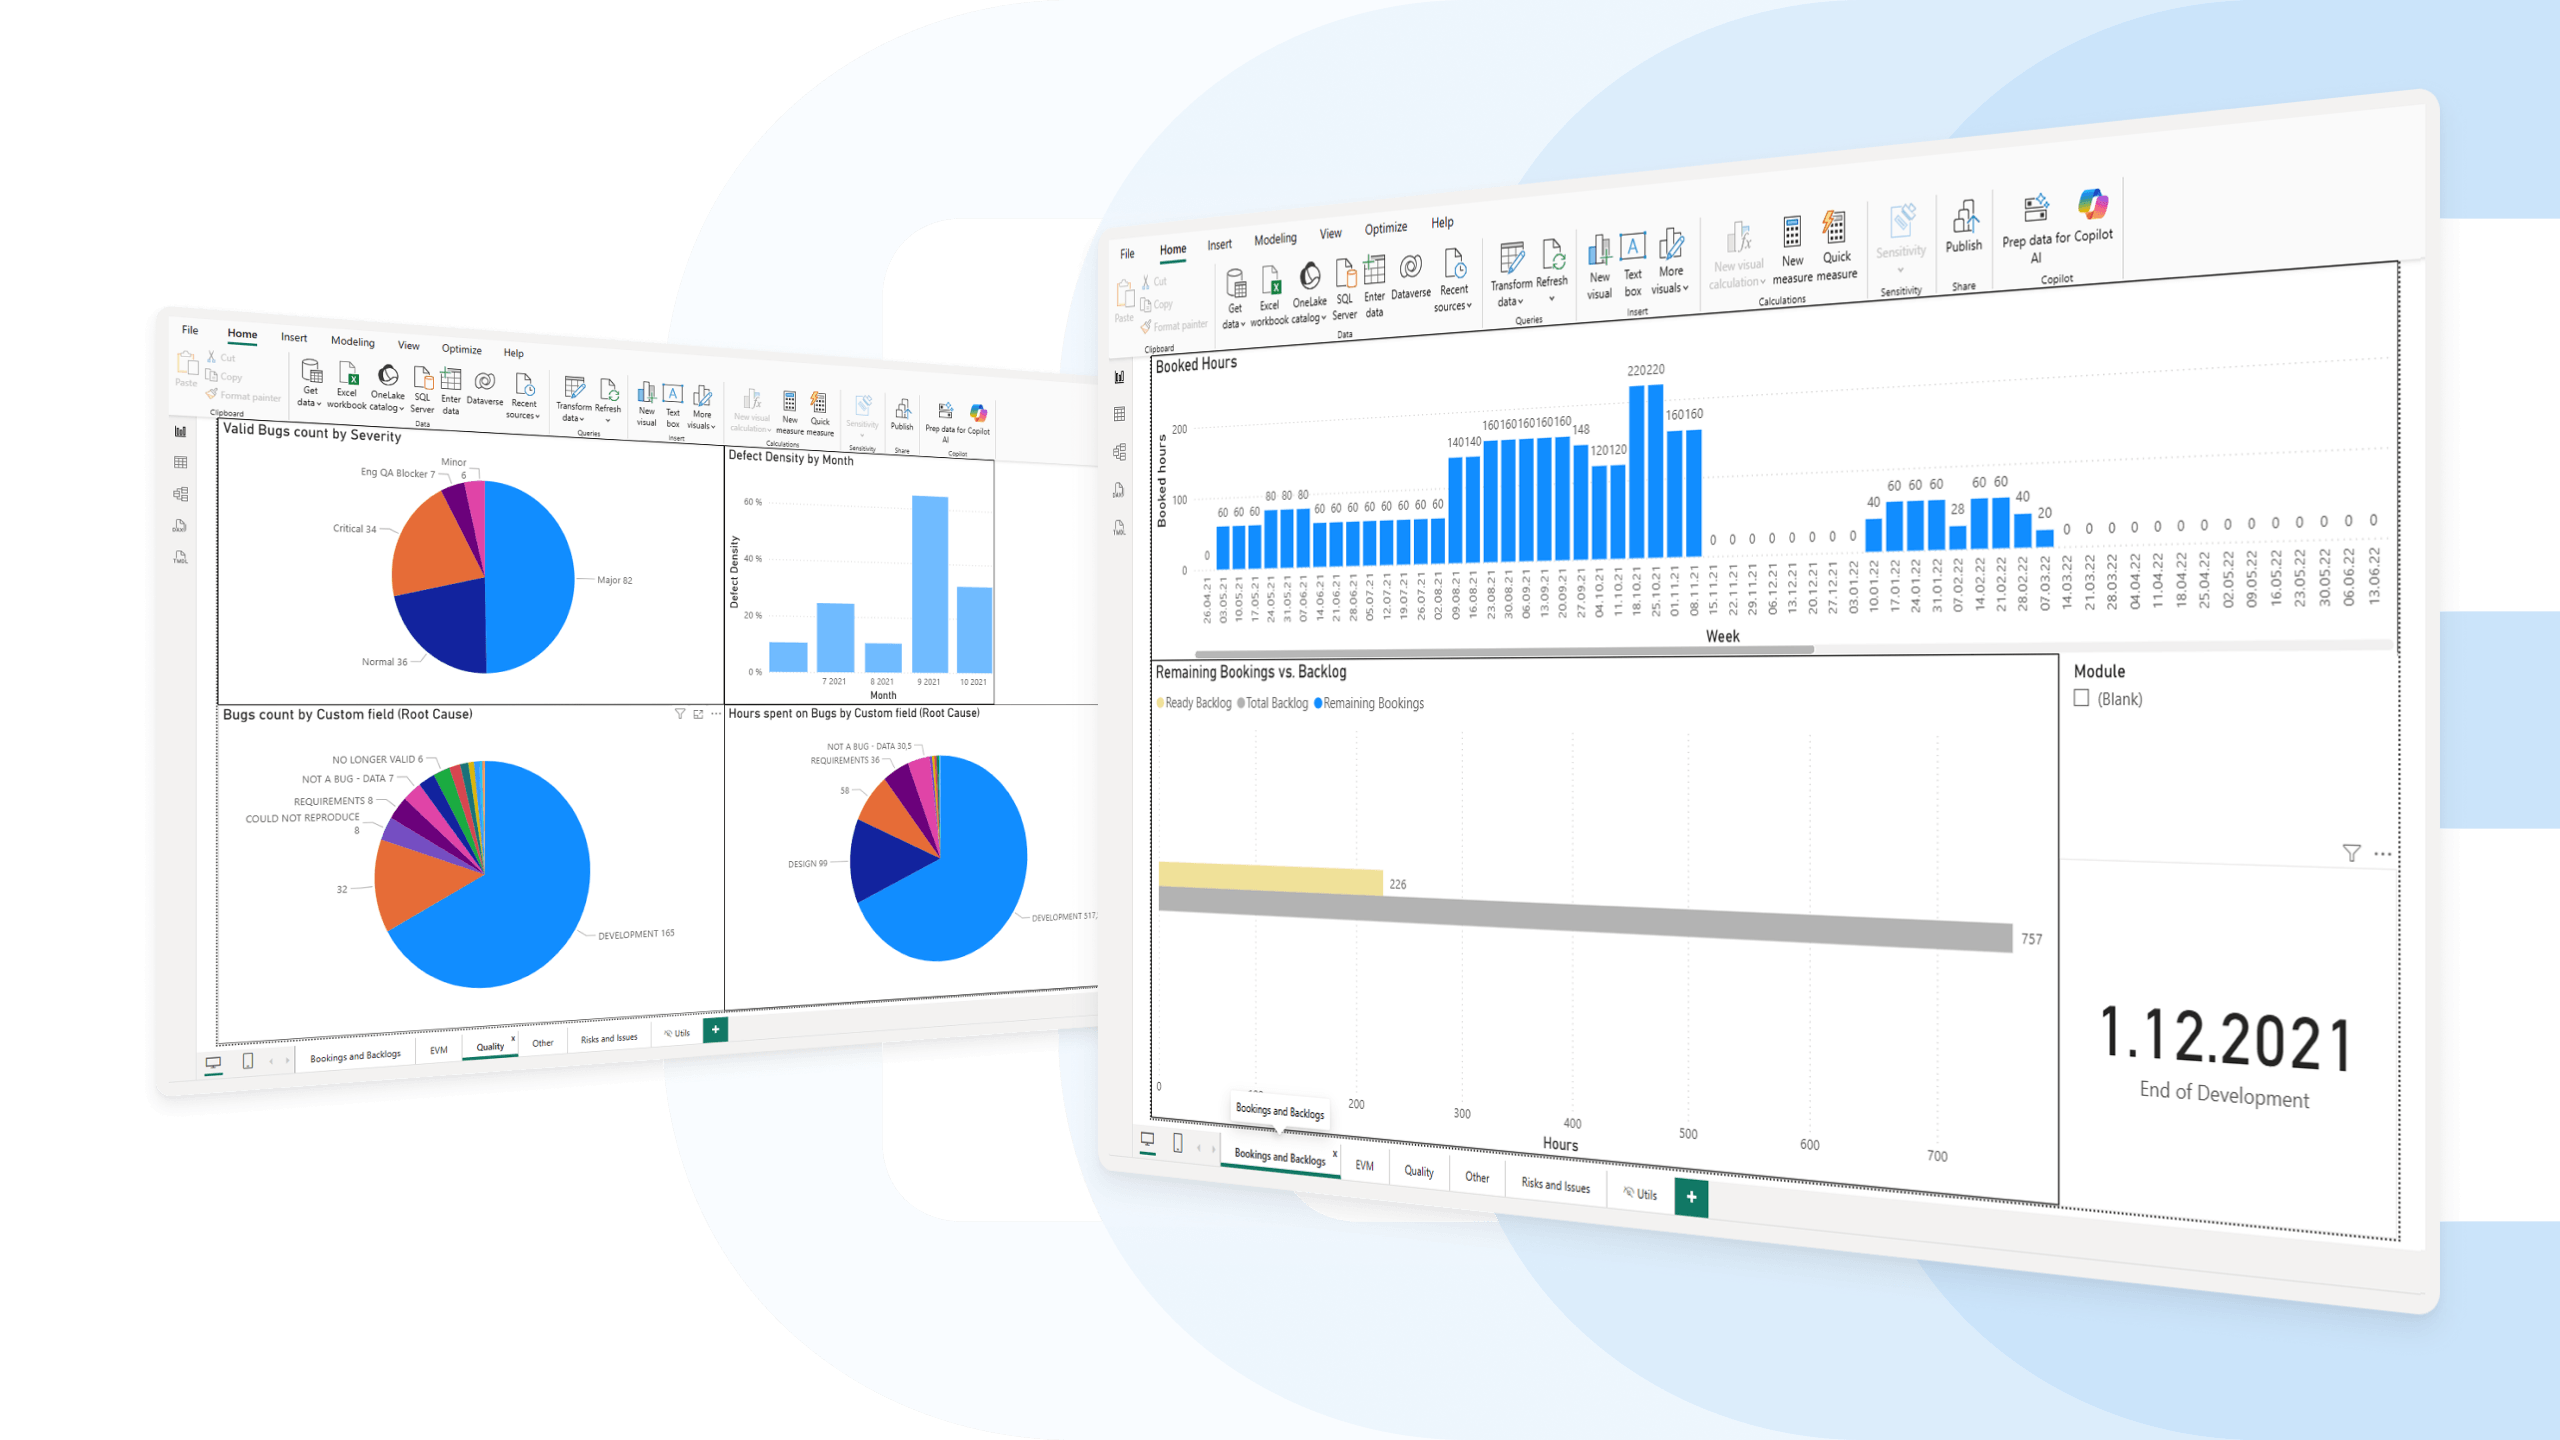
When companies work with millions of tasks, large volumes of logged hours, or need to combine data from Easy8 with ERP, CRM, or finance systems, standard in-platform reporting is no longer enough. In these cases, data is transferred through APIs into a data warehouse and visualised in tools like Power BI.
n8n helps automate these data flows and connects Easy8 with the rest of the reporting ecosystem.
Why it matters:
- provides robust reporting without affecting Easy8 performance
- one reporting layer across multiple business systems
- advanced BI reporting for management and leadership
- automated data flows through API and n8n integrations
2. Custom executive reporting in the format leadership wants
Many companies already use their own reporting templates — monthly PDFs, Word summaries, board reports, and executive updates.
The CEO or owner often does not want to log into another system to check dashboards. They want the report delivered automatically in the format they already use.
Using n8n and API integrations, specific data can be extracted from Easy8 and automatically transformed into custom PDF reports or executive summaries.
Why it matters:
- reporting adapted to management habits, not the other way around
- automatic delivery of PDF or custom reports
- no manual exporting or copy-pasting
- the right information reaches the right people instantly
Effective reporting is not only about dashboards inside Easy8. It is about delivering the right data to the right people in the format they actually use.
Easy8 Workflow Catalogue
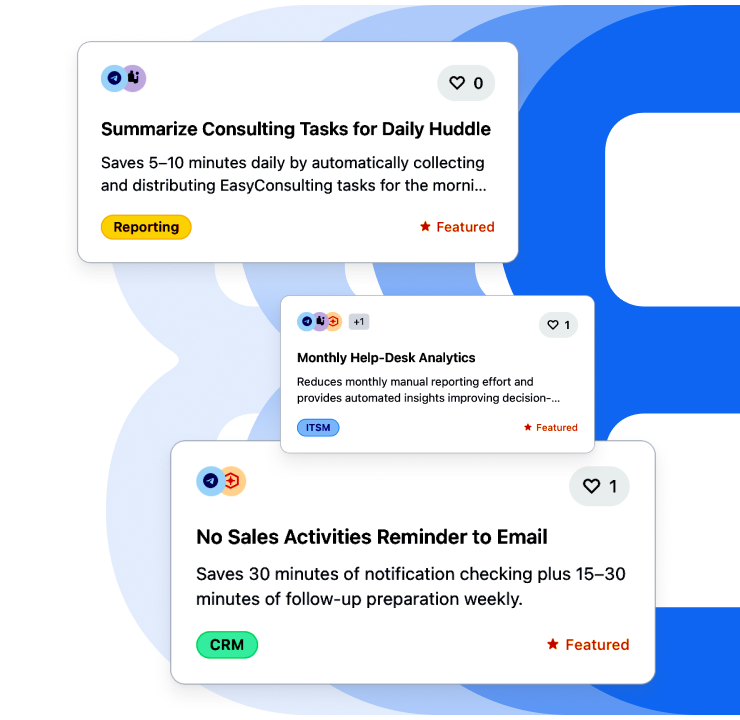
The Easy8 Workflow Catalogue gives you practical automation use cases built on n8n and Easy8. Instead of starting from scratch, you can explore real workflows that solve everyday problems across marketing, sales, operations, and support.
What is the offer
Workflows are organised by real use cases, so you can quickly find what’s relevant:
- Sales automation (lead enrichment, follow-ups).
- Marketing workflows (reporting, distribution).
- Project & delivery processes.
- IT & operations automations.
Each workflow shows how tools connect and what gets automated.
How to navigate
The easiest way to use:
- Start with your use case
- Understand the flow (trigger → action)
- Identify tools and integrations
- Map it to your setup
We continuously expand the catalogue based on real needs.
If a workflow is not available yet, you can request a specific automation or discuss your use case with an expert. Many workflows are still in development. You can join the waitlist to be notified once they are ready to use in the Easy8 environment.
New for AI-powered automation: Easy8 MCP Server and Easy8 CLI
Connecting Easy8 with AI agents and automation tools is now even easier. We are introducing two new tools that help customers and partners work with Easy8 data faster and with less custom development: Easy8 MCP Server and Easy8 CLI.
Easy8 MCP Server
MCP Server allows Easy8 to connect directly with MCP-compatible AI tools and AI agents. In practice, this means AI assistants can securely communicate with Easy8, access project data, and perform actions without the need for complex custom API calls in every workflow. It works especially well in environments like n8n, where MCP can be added as a tool for AI agents.
It reduces custom integration work for customers and partners while keeping security standards through API key authentication and existing Easy8 permissions.
Easy8 CLI
Easy8 CLI is a command-line tool for Easy8 designed for scripts, CI processes, and AI agents that execute commands automatically. It is especially useful for users working with tools like Claude Code, OpenCode, or Codex, where Easy8 can be used as a built-in skill for AI agents.
CLI simply means typing instructions directly to the computer in a terminal interface.
This makes automation faster and easier without writing custom API code for every task.
Meet Easy8 during our online sessions

Available now – webinar recordings:
- 26.02.2026 – AI-powered WorkOps foundations: From tool chaos to automated, AI-driven workflows
- 12.03.2026 – AI-powered WorkOps for Product teams: Faster delivery with n8n Automations & AI
- 26.03.2026 - AI-powered WorkOps for Project Managers: AI & n8n Automations beyond Gantt charts
- 09.04.2026 – AI-powered WorkOps for Marketing teams: Campaign execution powered by n8n Automations & AI
- 23.04.2026 – AI-powered WorkOps for Customer Success: Scaling delivery with n8n Automations & AI
- 07.05.2026 – AI-powered WorkOps for regulated environments: Implementing automations without losing control
Upcoming live sessions:
- 21.05.2026 at 14:00 – AI-powered WorkOps for collaborative work management: Connecting teams, tools, and decisions
- 04.06.2026 at 14:00 – AI-powered WorkOps for IT operations: Workflow automations for technical teams with n8n
For more technical details, see the latest Release notes for version: 15.9.0

