


Overview
Easy8 filters come with additional options that affect how filtered results are displayed. These options allow users to choose the output format, configure columns, group results, or adjust layout settings. This reference lists all supported filter-related features, display types, and their known limitations.
Accessing Filter Options
To access advanced filter options:
- Open any module with filter support (e.g. Tasks, Projects, Spent Time)
- Click the Options icon in the top-right corner (next to the Filters icon)
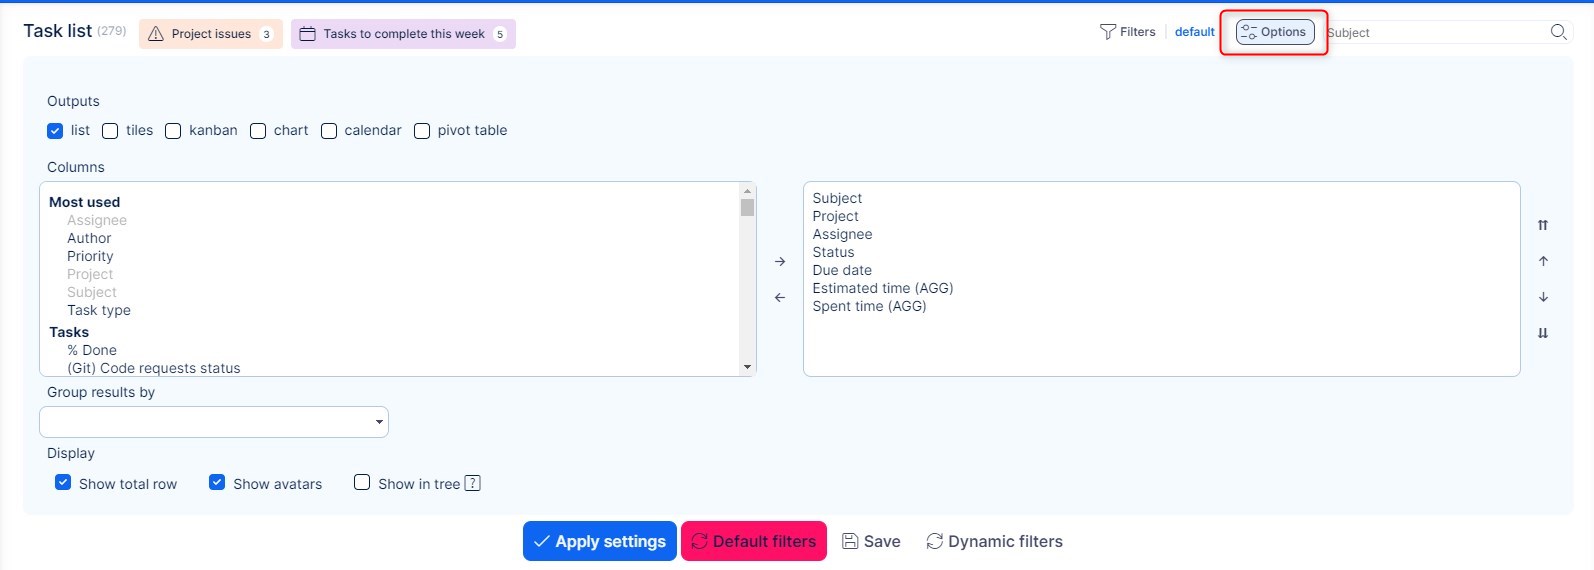
Output Types
The following output formats are available under Options:
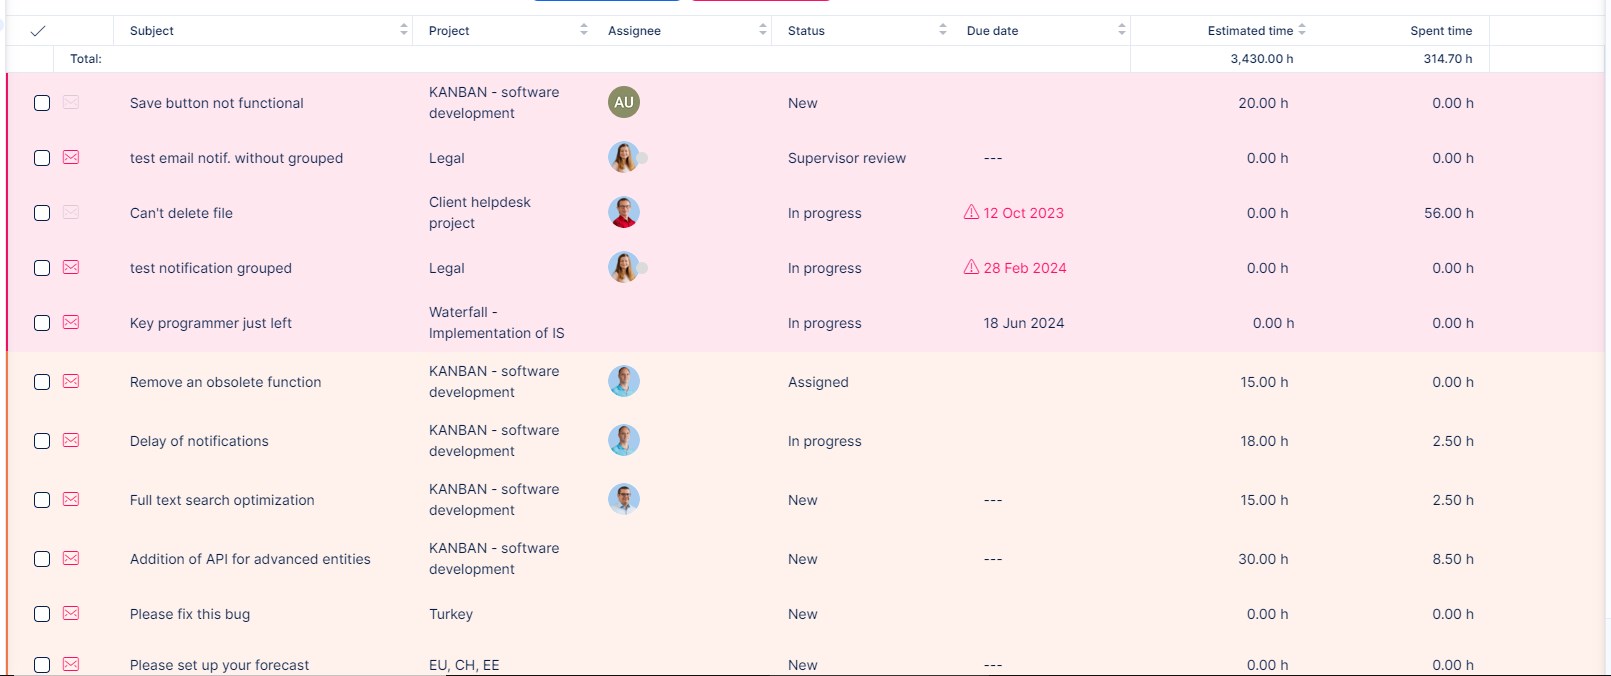
List
- Standard tabular view with rows and columns
- Supports grouping by various attributes
- Columns can be added, removed, or reordered
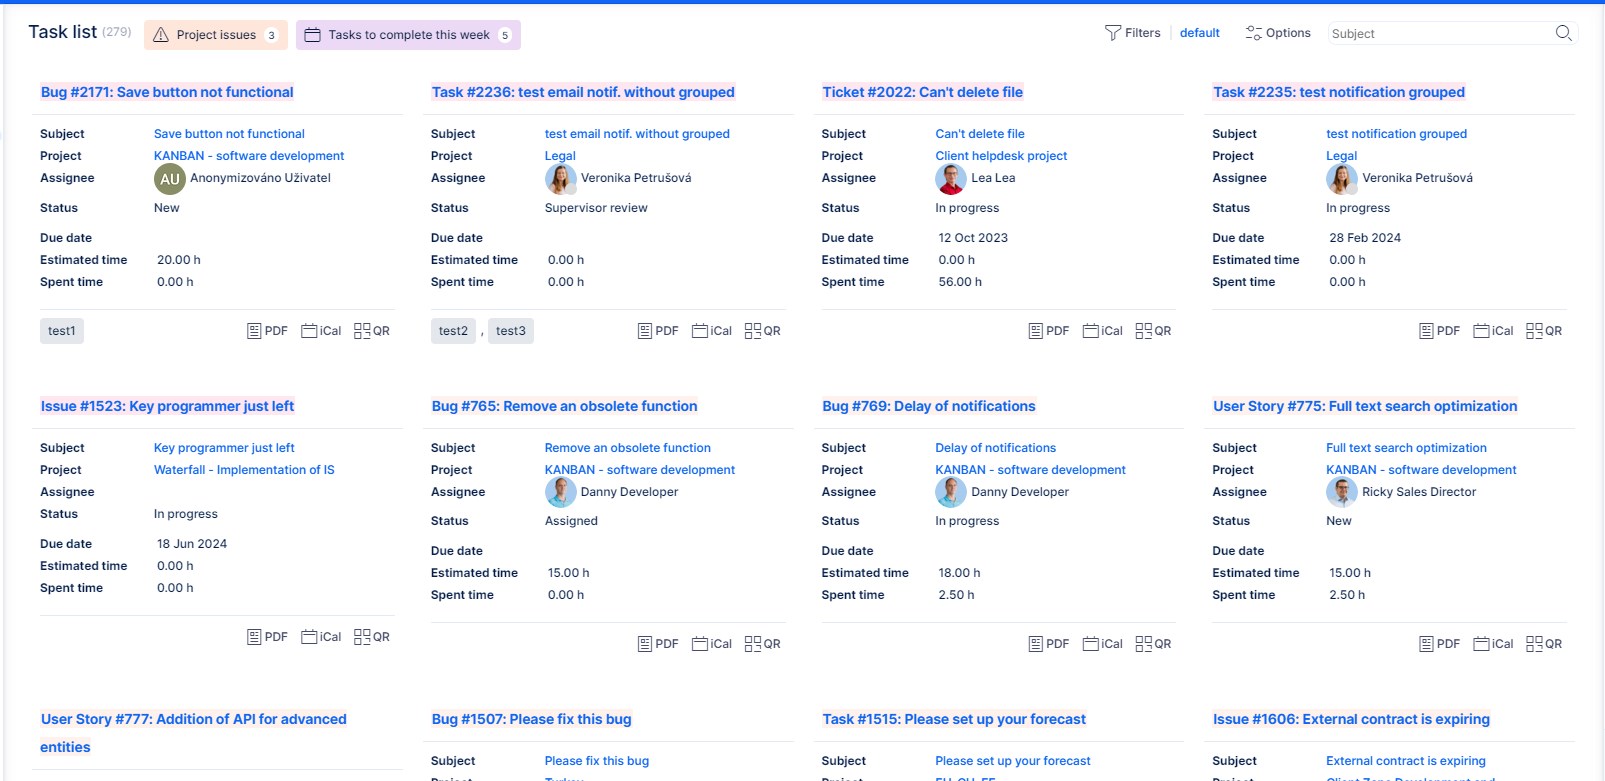
Tiles
- Shows results as individual tiles
- No additional customization options
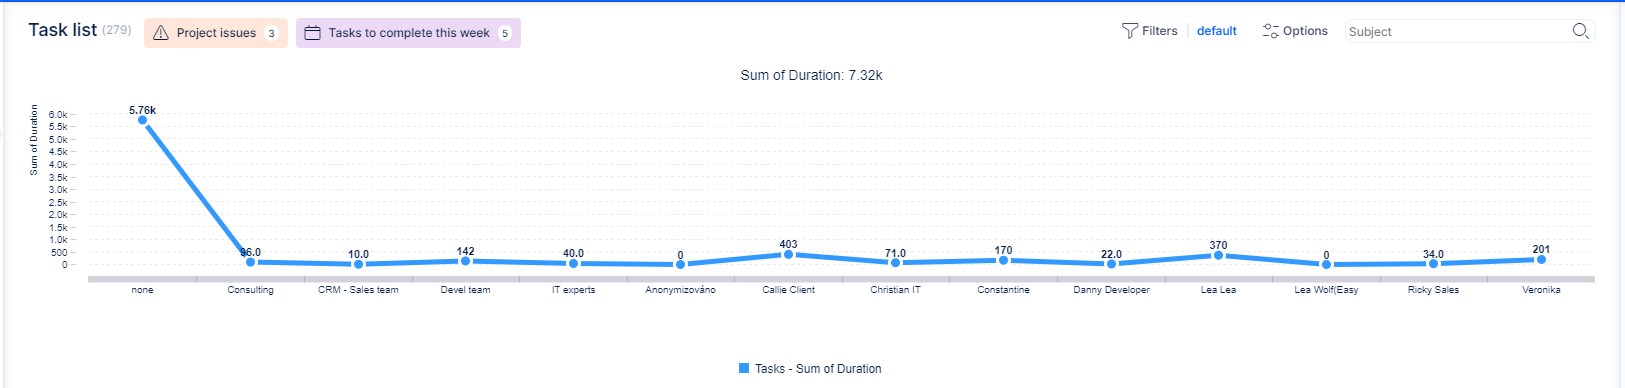
Chart
- Visual output in line, bar, or pie format
- X and Y axis values are configurable
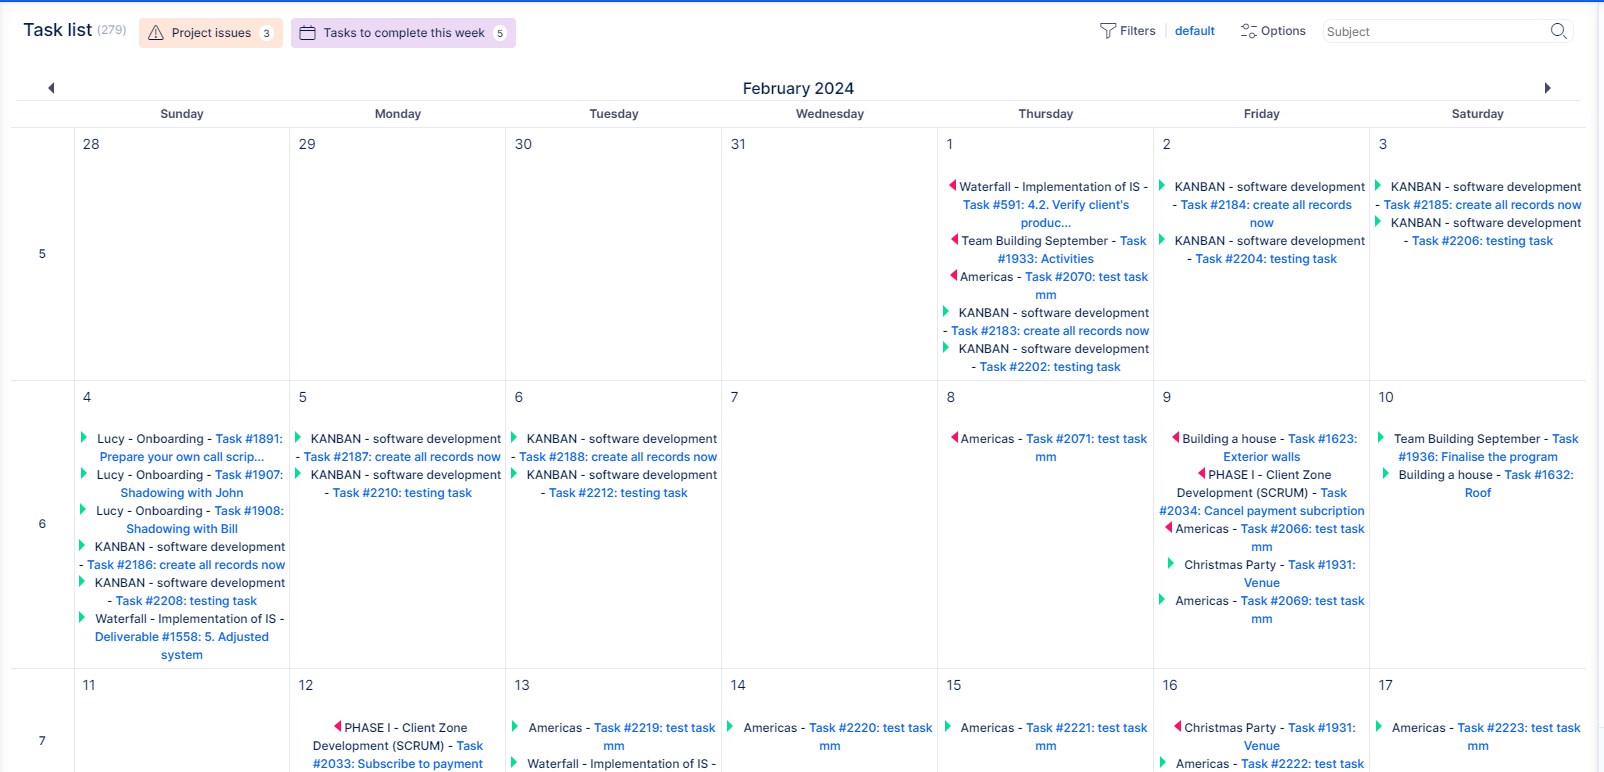
Calendar
- Displays results on a time grid
- Time period is configurable
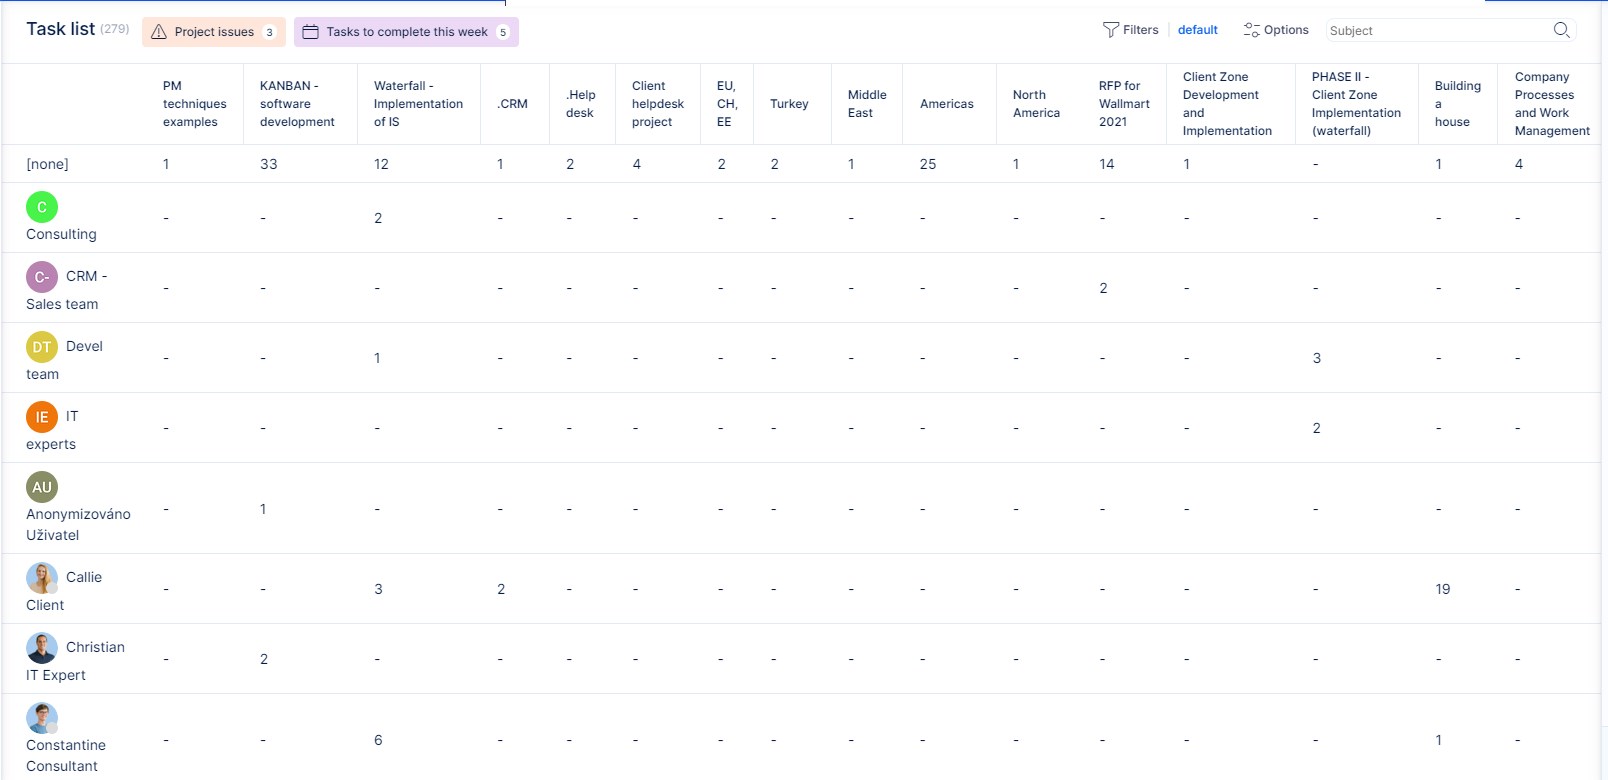
Pivot Table
- Report-like view with horizontal and vertical grouping
- Supports summarization and count checkbox
- Used in plugins like Money → Portfolio overview
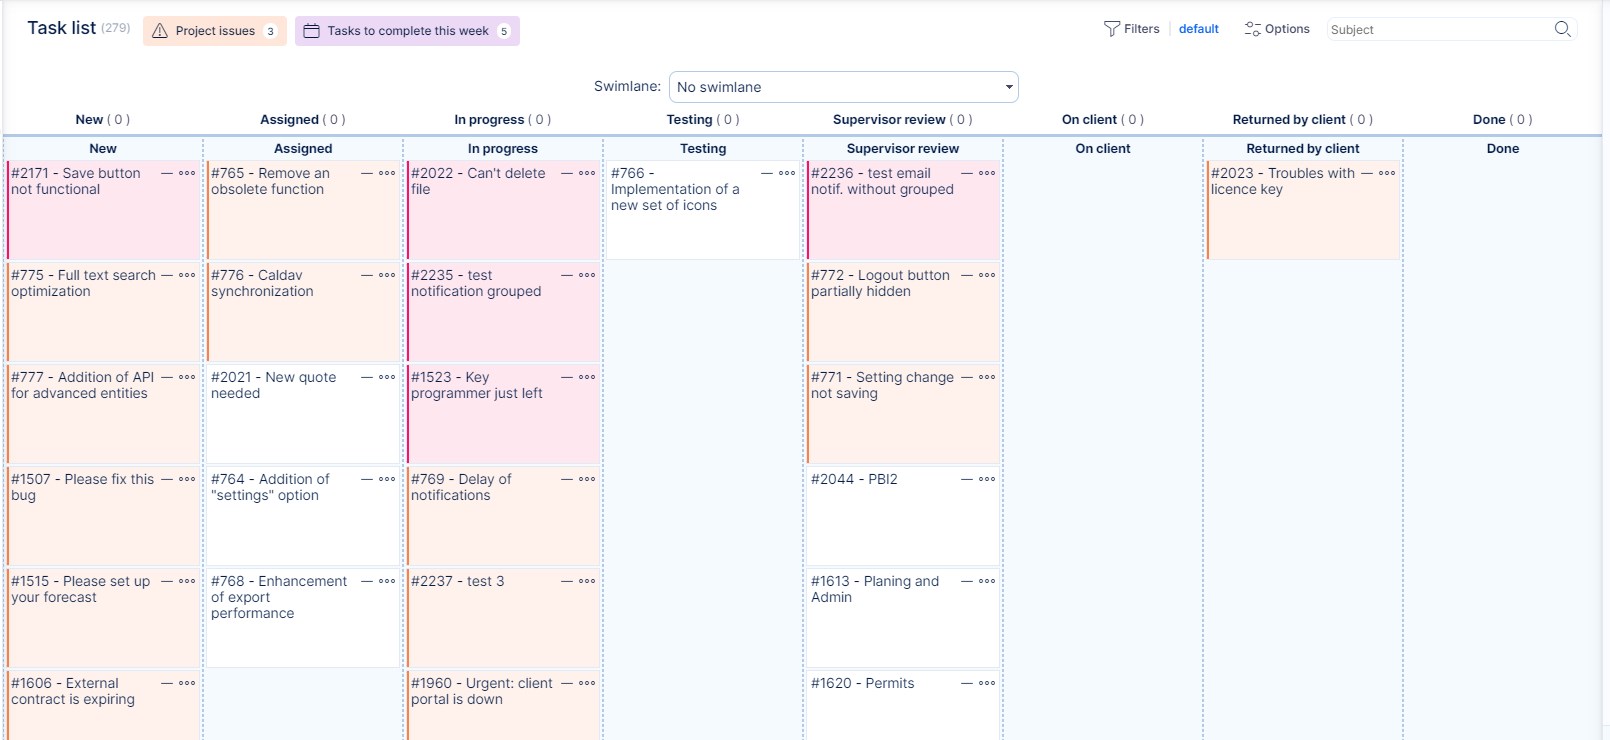
Kanban
- Displays results on a customizable Kanban board
- Supports workflow-like task organization
Supported Options and Behaviors
| Feature | Description |
|---|---|
| Show avatars | Only works in List view on native user fields (not custom/lookup fields). Not supported in Easy Gantt. |
| Load groups opened | Works in List view when grouping is enabled. Project list also requires grouped view for opened display. |
| Exporting | Export buttons (bottom-right) only work for List view. Not available for Tiles, Chart, Calendar, or Pivot Table. |
| Saved Filters Management | Only supports List output type. Charts or other outputs are not supported. |
| Group by | Works only with List output. Other formats will not show results if grouping is used. |
| Default filters | Always load in List format for performance reasons, even if the filter was saved with another output type. |
| Chart time unit override | Changing the chart time unit (e.g. day/week/month) resets the selected time period to default. |
| Total row | Does not sum "Total estimated time" or "Total spent time" to avoid double-counting subtasks. Use "Estimated time" and "Spent time" instead. |
| Persistent filters | Task list filters are not remembered when navigating away. Other pages do restore filters automatically. |
| URL length limit | Filter URLs have a maximum length of 10240 characters. Longer URLs may cause error 414. |
| Project/subproject filter visibility | Filters with “For all projects” enabled are visible system-wide. Filters for subprojects only are hidden unless the user is assigned to the parent project. |
| Horizontal scrolling | If bottom scroll bar is missing, use SHIFT + scroll. You can also disable auto-loading in user preferences (User > Edit > Disable automatic loading). |
Filtering by Role on Project List
- Set filter Project members is: [username]
- Add filter Role is: [select role(s)]
Both filters must be used together for accurate results.
Summary
These options and limitations help fine-tune how filters behave and how filtered data is displayed in Easy8. Understanding these settings helps avoid unexpected behavior and ensures you’re using the best format for your data needs.

