


Introduction
Dashboards in Easy8 help users understand project data in a visual way. They are important because they show real-time information using charts, graphs, and widgets. This helps teams make better and faster decisions.
Target Audience
- User
- Administrator
Understanding Dashboards
Definition
Dashboards are customizable pages in Easy8 that show important information using visual tools. Key components include:
- Widgets: Visual elements like charts or tables
- Templates: Predefined layouts for common use cases
- Custom dashboards: Dashboards users create or change based on their needs
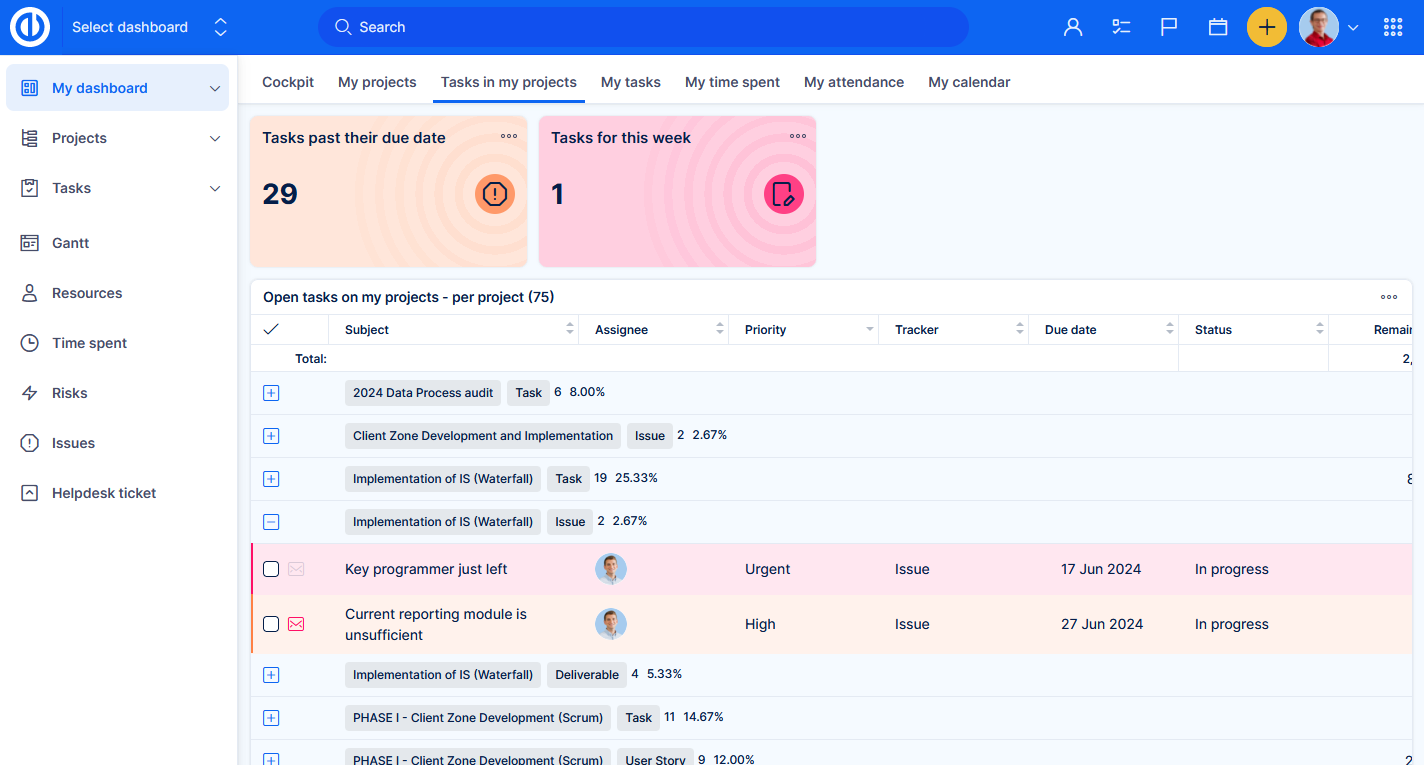
How It Works
Dashboards collect and display real-time data from projects, tasks, time tracking, and other modules. Users can:
- Add and arrange widgets as needed
- Choose templates for different departments (like finance or project management)
- Customize dashboards per role, user, or group
Dashboards can include data from multiple sources in one place. They can also be saved and reused. Some dashboards are made for personal use, while others are shared with teams or departments.
Examples of dashboard types:
- Project Dashboard: Shows status and tasks of a specific project
- User Dashboard: Personalized view of current tasks, time, and performance
- Finance Dashboard: Displays project budgets, revenues, and costs
Each dashboard can help users stay focused and understand key performance metrics.
Examples
- A project manager can use a project dashboard to monitor task progress and deadlines.
- An HR team might use a custom dashboard to show employee attendance and workload.
Conclusion
Dashboards in Easy8 are powerful tools for tracking and visualizing data. They help teams and individuals stay informed and make smarter decisions based on live project information.

