


Introduction
This guide explains how to use the Pie Chart widget in Easy8 dashboards. Pie charts show proportions as slices of a circle, making it easy to compare parts of a whole. They are commonly used in business to visualize things like task distribution, time usage, or project budgets.
Target Audience
- User
Prerequisites
- Access to a dashboard
- Permission to customize the dashboard and add widgets
- Data tracked in the system for the selected entity
How to Use Pie Charts on Dashboards
Step 1: Add the Pie Chart Widget
- Open your dashboard
- Click Customise
- Use the Select widget from list panel to insert the Pie Chart widget
Step 2: Select Entity and Name the Chart
- Choose the Entity (e.g., Tasks, Users, Projects, CRM)
- Enter a clear Name for the chart
Step 3: Apply Filters (Optional)
- Use Filters to narrow the data set (e.g., Task Status is Open, Assignee is Me)
- Global filters from the dashboard will apply automatically
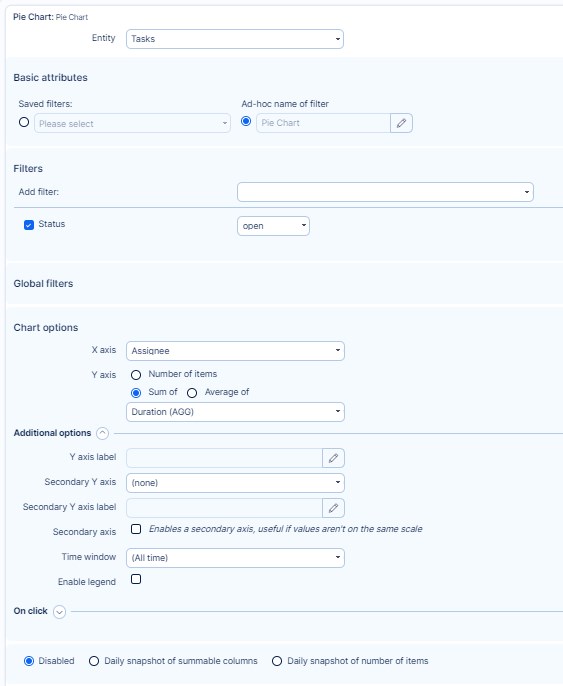
Step 4: Configure the Chart Options
- Select the X-axis – defines how data is grouped (e.g., by status, priority, user)
- Select the Y-axis – defines what is being measured (e.g., number of tasks, total time)
- Optional settings:
- Labels for each slice
- Slice limit or sorting order
- Time window if applicable
- On click behavior (in Business Dashboards)
Step 5: Set Caching Options (Optional)
- Choose how many days the chart data should be cached
- Leave blank for default caching (1 day)
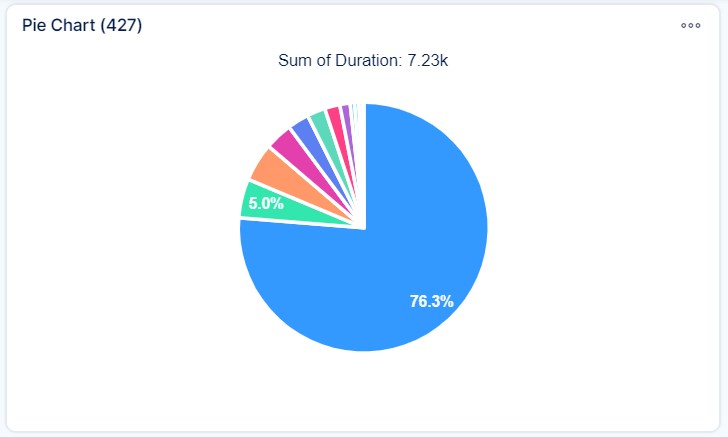
Step 6: Save and View
Click Save page and go back. Your pie chart will now appear on the dashboard, showing visual proportions of the selected data.
Conclusion
Pie charts in Easy8 provide a quick way to compare categories within a data set. They are ideal for visualizing distribution and balance, and with the available filters and options, you can focus on exactly the data that matters to you.

