


Introduction
This guide shows how to make dashboards in Easy8 more interactive using on-click charts. These charts let users click directly on a chart segment (like a bar or slice) to open a filtered list with more details.
Target Audience
- User
- Administrator
Prerequisites
- A customizable dashboard
- Permissions to add and configure dashboard widgets
- A chart widget (e.g. Bar Chart or Pie Chart)
- A configured saved filter or list view
How to Use On-Click Charts in Dashboards
Step 1: Add and Configure a Chart Widget
- Go to your dashboard and click Customize
- Add a chart widget like Bar Chart
- Apply a filter to show the data you want (e.g. Tasks per Assignee)
- Save the widget
Step 2: Open the Underlying Filter
- Click on the widget name to open the filter in a new tab
- In that tab:
- Go to Options
- Set Output = List only
- Apply the changes
- Copy the full URL from your browser’s address bar
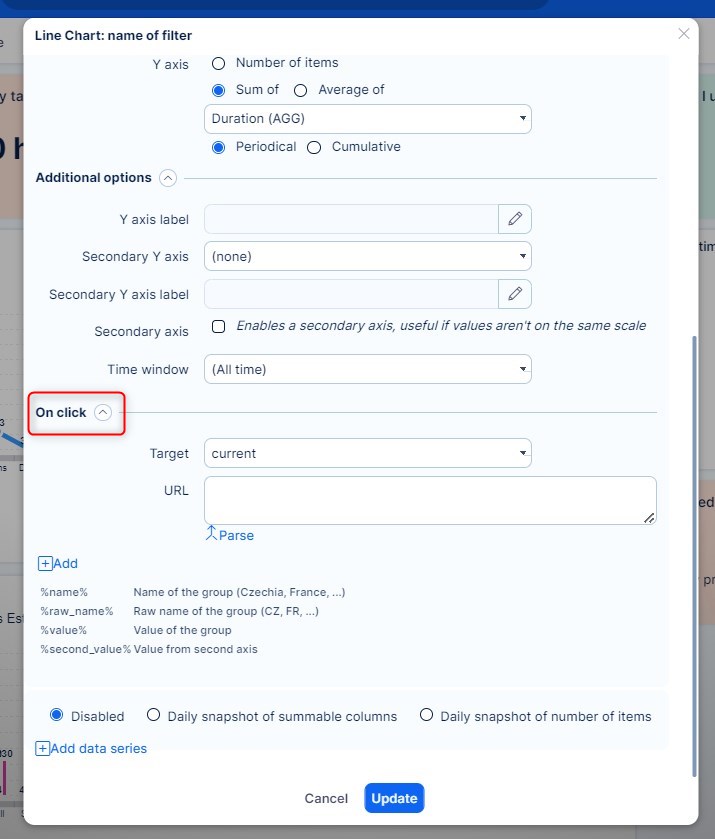
Step 3: Configure On-Click Behavior
- Return to the original chart widget
- Open its Settings > On click section
- Paste the copied URL into the URL field
Step 4: Edit Filter Parameters
- Replace specific values in the filter with dynamic placeholders:
- For example, change
f[assigned_to_id]=5
tof[assigned_to_id]=%raw_name%
- For example, change
- Add chart column names (comma-separated) to the input field
- Select how the filtered view should open:
- Current – In the same tab
- Blank – In a new tab
- Modal – In a quick-view popup
You can adjust or remove other parsed parameters, like Show_sum_row=1, if needed.
Step 5: Final Result
Now your chart is interactive. For example, clicking on a bar in a Tasks per Assignee chart will open a filtered list showing only the tasks for that assignee, in a quick modal window or new tab—based on your chosen behavior.
Conclusion
On-click charts turn static dashboards into interactive data tools. By linking charts to detailed filtered lists, users can dive deeper into the data with just one click. Global filters further enhance this by syncing data views across widgets, saving time and improving visibility.

