


Introduction
This guide explains how to use the Baseline feature in Easy8 chart widgets. Baselines allow you to save the current state of a chart and return to it later. This is useful for tracking how data changes over time. Baselines can be used in Pie, Bar, and Line charts on customizable dashboards.
Target Audience
- User
Prerequisites
- A Pie, Bar, or Line chart widget added to a customizable dashboard
- Permissions to interact with dashboard widgets
How to Use Baseline in Charts
Step 1: Identify the Baseline Icon
- Go to your dashboard and locate a Pie, Bar, or Line chart
- Look for the lightning icon on the widget — this represents the Baseline feature
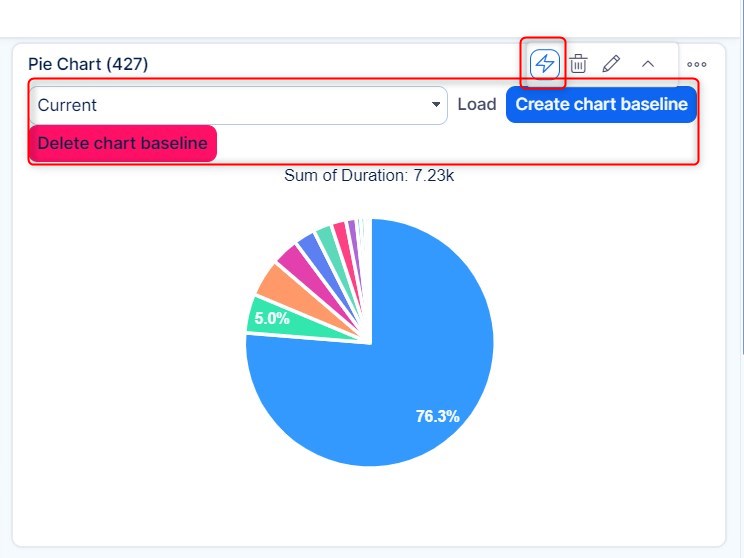
Step 2: View Existing Baselines
- Click the lightning icon
- A drop-down list of available baselines will appear
- You’ll also see two buttons: Create baseline and Delete
Step 3: Create a New Baseline
- Click the Create baseline button
- Refresh the page
- The new baseline will now appear in the drop-down list
Step 4: Load a Saved Baseline
- Click the lightning icon again
- Select a baseline from the list
- Click the Load button to display the chart in the saved baseline state
Step 5: Delete a Baseline
- To remove a baseline, click the Delete button next to the Create button
- This will remove the selected baseline from the list
Conclusion
Baselines in Easy8 charts are a helpful way to save and compare changes in your visual data over time. Whether you're tracking project progress or monitoring KPIs, this feature gives you quick access to saved chart states without losing your current configuration.

