


Introduction
This guide explains how to use a Generic Gauge widget in Easy8 to track how much time has been logged by a user compared to the expected amount. It’s a simple and visual way to monitor daily performance or time logging habits.
Target Audience
- User
Prerequisites
- Access to a dashboard
- Permission to customize and add widgets
- Logged spent time data and planned allocation data (for dynamic mode)
How to Use a Gauge to Show Spent Time
Step 1: Add the Generic Gauge Widget
- Open your dashboard
- Click Customise
- Choose Generic Gauge from the list of widgets
Step 2: Set the Needle Entity
Select Spent time as the needle entity
This value will be shown on the gauge as the logged time
Step 3: Choose Max Value Mode
You have two options for setting the Max number of the gauge:
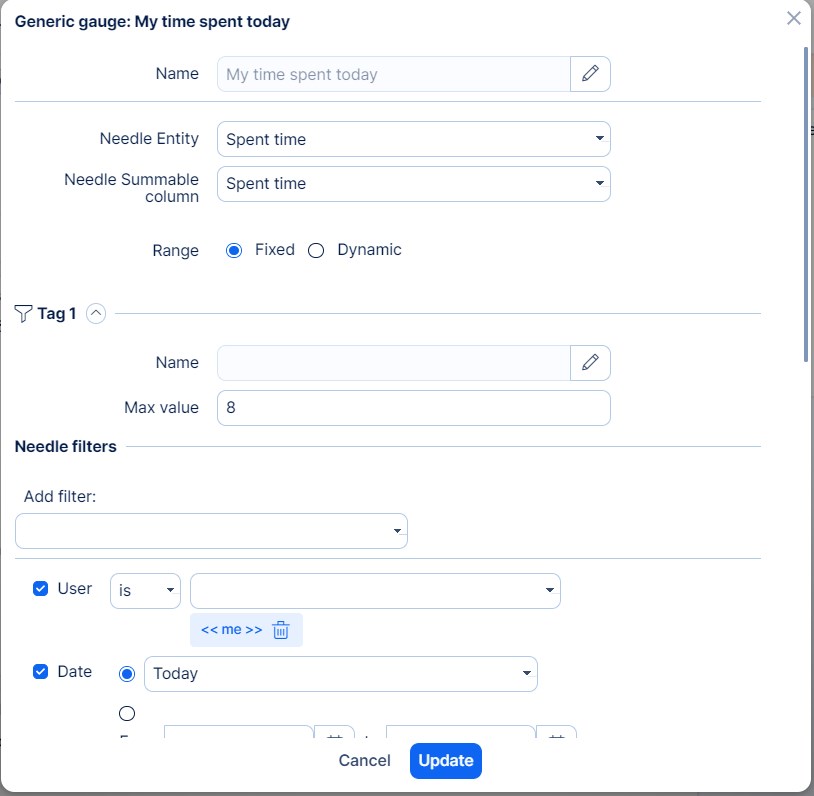
Option 1: Fixed Max Value
- Choose Fixed as the range type
- Enter a number manually (e.g., 8 hours per day)
- Set filters:
- User is <<me>>
- Date is Today
This setup shows how many hours you logged today compared to a fixed daily target.
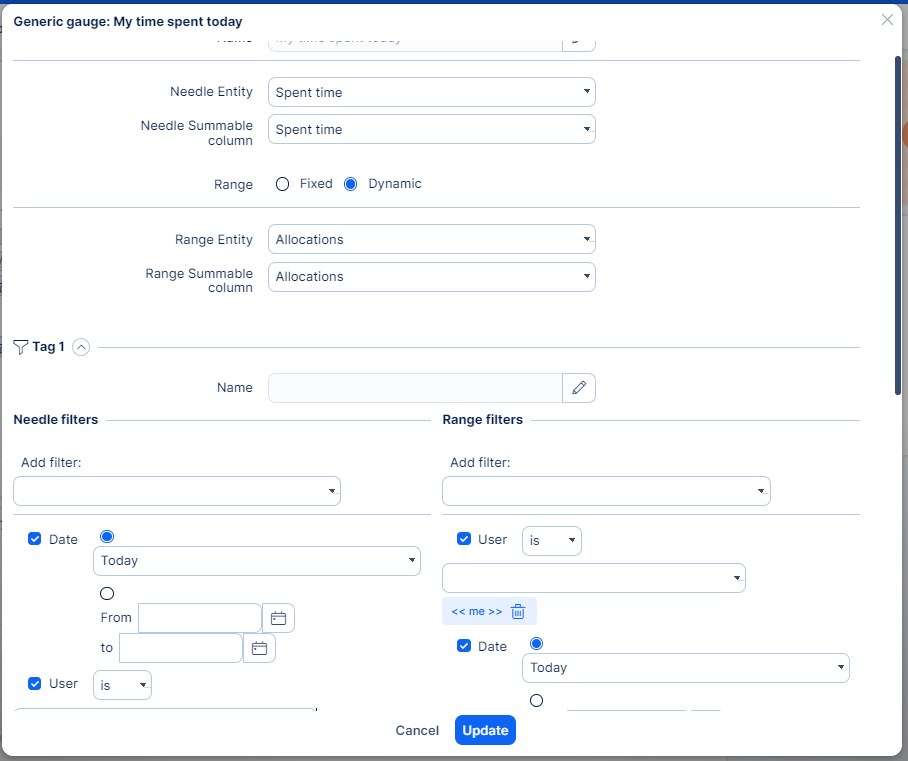
Option 2: Dynamic Max Value
- Choose Dynamic as the range type
- Set the range entity to Allocations
- Apply filters:
- User is <<me>>
- Date is Today
The gauge will now compare your logged time to your personal allocation for the day.
This method adjusts automatically based on your schedule.
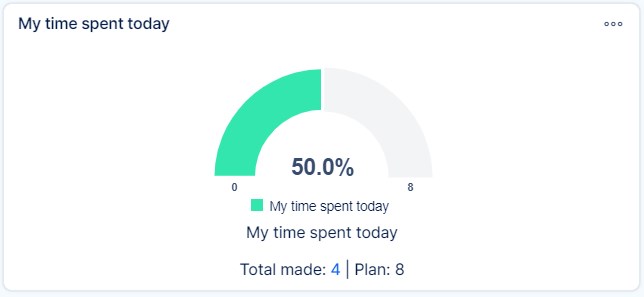
Step 4: Save and Use
- Click Save page and go back
- The gauge will now show your logged time versus your daily target (fixed or dynamic)
- The display updates automatically as data changes
Conclusion
Using a Generic Gauge to show spent time on a dashboard in Easy8 helps you quickly see if you're meeting your daily work targets. Whether using a fixed value or dynamic allocation, it gives a clear view of your time tracking at a glance.

