


Introduction
This guide shows you how to use the Trends widget in Easy8 to monitor key metrics. The Trends widget is a space-saving alternative to traditional lists. It helps you track totals, compare time periods, and even perform calculations between data sets — all with a clear visual format.
Target Audience
- User
- Administrator
Prerequisites
- Access to a dashboard
- Permission to customize the dashboard and add widgets
How to Track Trends with the Trends Widget
Step 1: Add the Trends Widget
- Open your dashboard
- Click Customise
- Add the Trends widget from the widget list
Step 2: Configure Basic Settings
- Select Entity Type – Choose what type of items you want to monitor (e.g., tasks, milestones, tickets)
- Name and Description – Give your widget a clear, meaningful title. Description is optional, keep it short if used
- Show – Specify which "total" you want to monitor
- Filters - Define which items will be counted
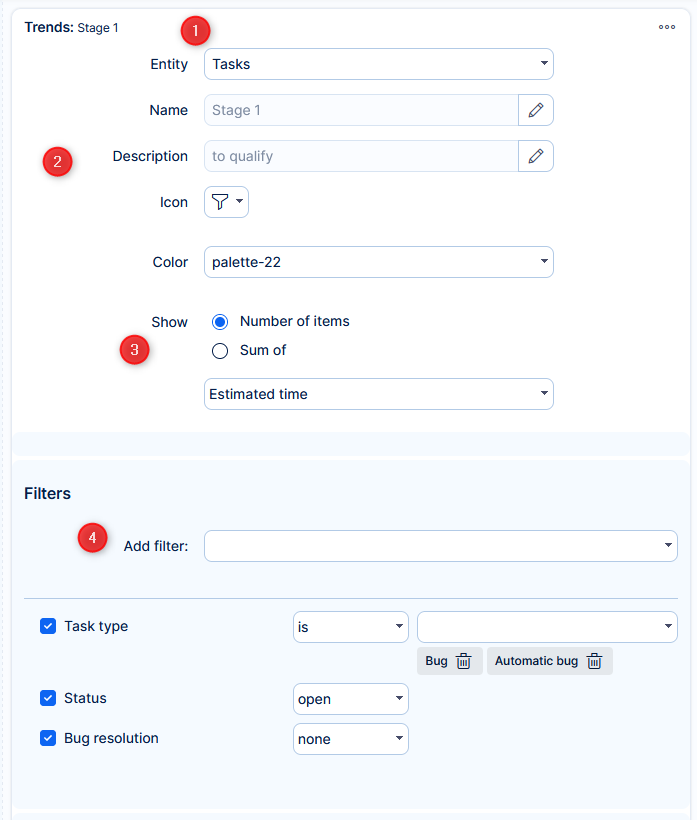
Example: Show the number of high-priority tasks with status "open"
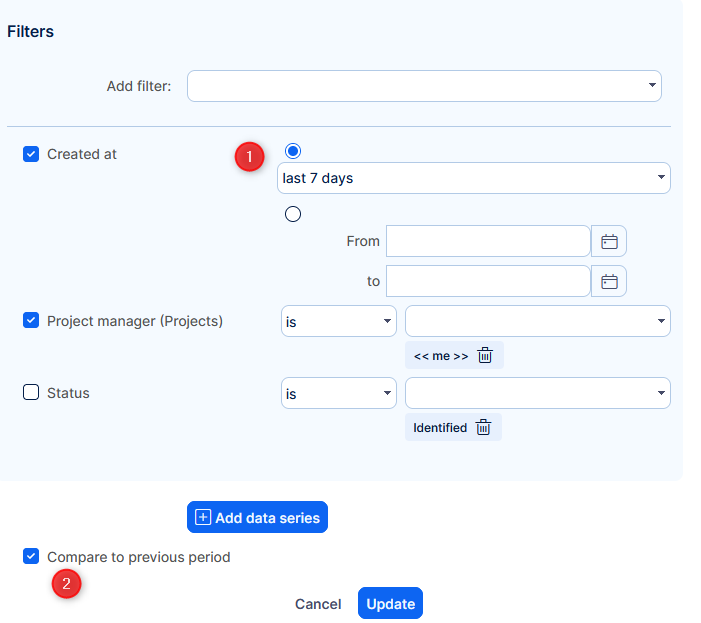
Step 3: Enable Comparison to Previous Period
- Add a time-based filter (e.g., tasks created in the last 30 days)
- Tick the Compare to previous period box
The widget will now show a percentage change compared to the same length of time before the current period.
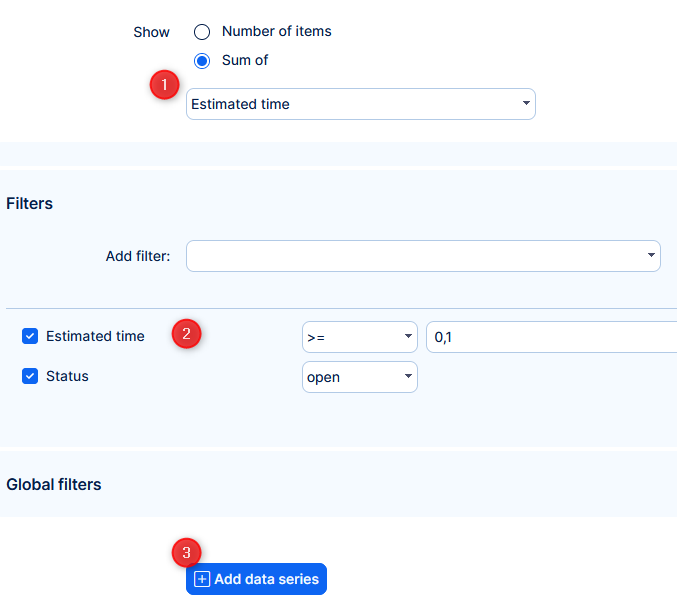
Step 4: Add a Secondary Data Series (Optional)
- Set trend to count the sum of estimated time
- Define which items (based on their attributes) will be counted
- Add data series
- Select operator
- Basic math: +, –, ×, ÷
- Special: < operator to display the primary value and % difference from the second series
- Set to count number of items (in our example)
- Define which items (based on their attributes) will be counted
Example: Compare total estimated time vs. number of tasks to get average time per task
Step 5: View and Interact
- The widget displays the current trend and comparison (if enabled)
- Click the widget to open a pop-up list of the items it represents
- Columns shown in the pop-up follow your default filter settings
Conclusion
The Trends widget in Easy8 is a powerful and compact tool to track performance. With support for filters, time-based comparisons, and mathematical operations, it helps you monitor key metrics in real-time and understand how they change over time.

