


Introduction
This guide explains how to set up Dashboards in Easy8 to track project performance. Dashboards are customizable views that provide visual insights using widgets like charts, tables, and graphs. They help managers monitor key metrics, track progress, and make informed decisions.
Target Audience
- Project Managers
- Team Leaders
- Executives
Prerequisites
Before setting up a dashboard, ensure you have:
- Access to dashboard customization features.
- Knowledge of which project data or KPIs you want to display.
- The required permissions to configure widgets and reports.
How to Set Up Dashboards for Project Tracking
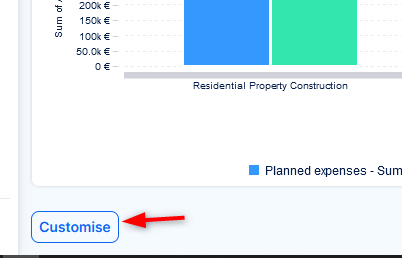
Step 1: Access Dashboard Customization
- Go to your homepage or any existing dashboard view.
- Click the Customise button at the lower left corner of the page.
Step 2: Choose and Add Widgets
- From the list of available widgets, select those that match the type of data you want to track. Examples include:
- Project Information
- Allocations
- Spent Time Charts
- Upcoming Deadlines
- Gantt View
- Add the widgets by selecting their position in the layout grid.
Step 3: Configure Widget Settings
- Widget may offer various filter options (e.g., by project, user, status).
- Adjust settings to display the most relevant information.
- Save any changes within each widget if prompted.
Step 4: Create Multiple Tabs
- Click Add Tab at the top of the page.
- Populate the new tab with widgets of a common reporting area, e.g. finance.
- Create as many tabs as you need.
Step 5: Save Your Dashboard
- After arranging and configuring widgets, click Save page and go back.
- Your personalized dashboard is now active and ready to use.
Tips for Effective Dashboards
- Group related widgets (e.g., all time tracking in one column).
- Use charts and visual indicators for better clarity.
- Regularly review dashboard content and update filters as needed.
- Create multiple dashboards for different roles (e.g., one for executives, one for project teams).
Conclusion
Setting up dashboards in Easy8 gives you a powerful tool to monitor project health in real time. With the right combination of widgets and filters, you can create focused views that highlight key performance indicators and support faster decision-making.

