How to Build SLA Dashboards and Reports
Introduction
This guide shows you how to measure SLA performance on your HelpDesk tickets with dashboards and how to export tickets with their SLA attributes for reporting outside Easy8. All SLA values are stored directly on tickets, so you build every metric on the Tasks entity. SLA rule settings in HelpDesk projects are not covered here.
Target Audience
User + Administrator
Prerequisites
Before you start, make sure you have:
- SLA rules set up in at least one HelpDesk project.
- Permission to create or edit dashboards.
- Permission to see SLA data on tickets (View SLA events in your role).
Understanding SLA Metrics
Definition
- First Response SLA – time from ticket creation until the first status change. (An automatic reply sent by HelpDesk does not fulfil it.)
- Resolution SLA – time from ticket creation until the ticket is resolved and closed.
How It Works
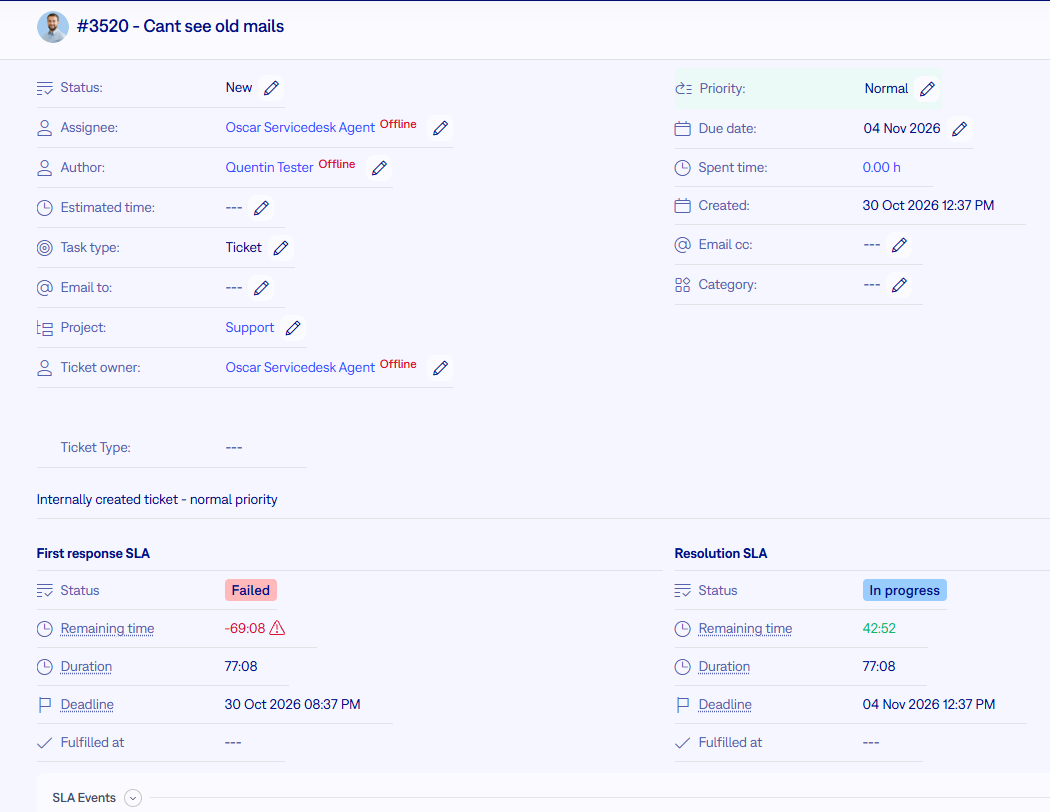
Each ticket shows the following values separately for the First Response SLA and the Resolution SLA:
| Field | Format | Meaning |
|---|---|---|
| Status | In progress, Passed, Failed, On hold | Current state of the SLA |
| Remaining time | hh:mm | Positive value is time left until the deadline, negative value is overdue time. Respects business hours if set. |
| Duration | hh:mm | Time since ticket creation. Respects business hours if set. |
| Deadline | Date and time | SLA deadline |
| Fulfilled at | Date and time | Moment the SLA was fulfilled, regardless of the result |
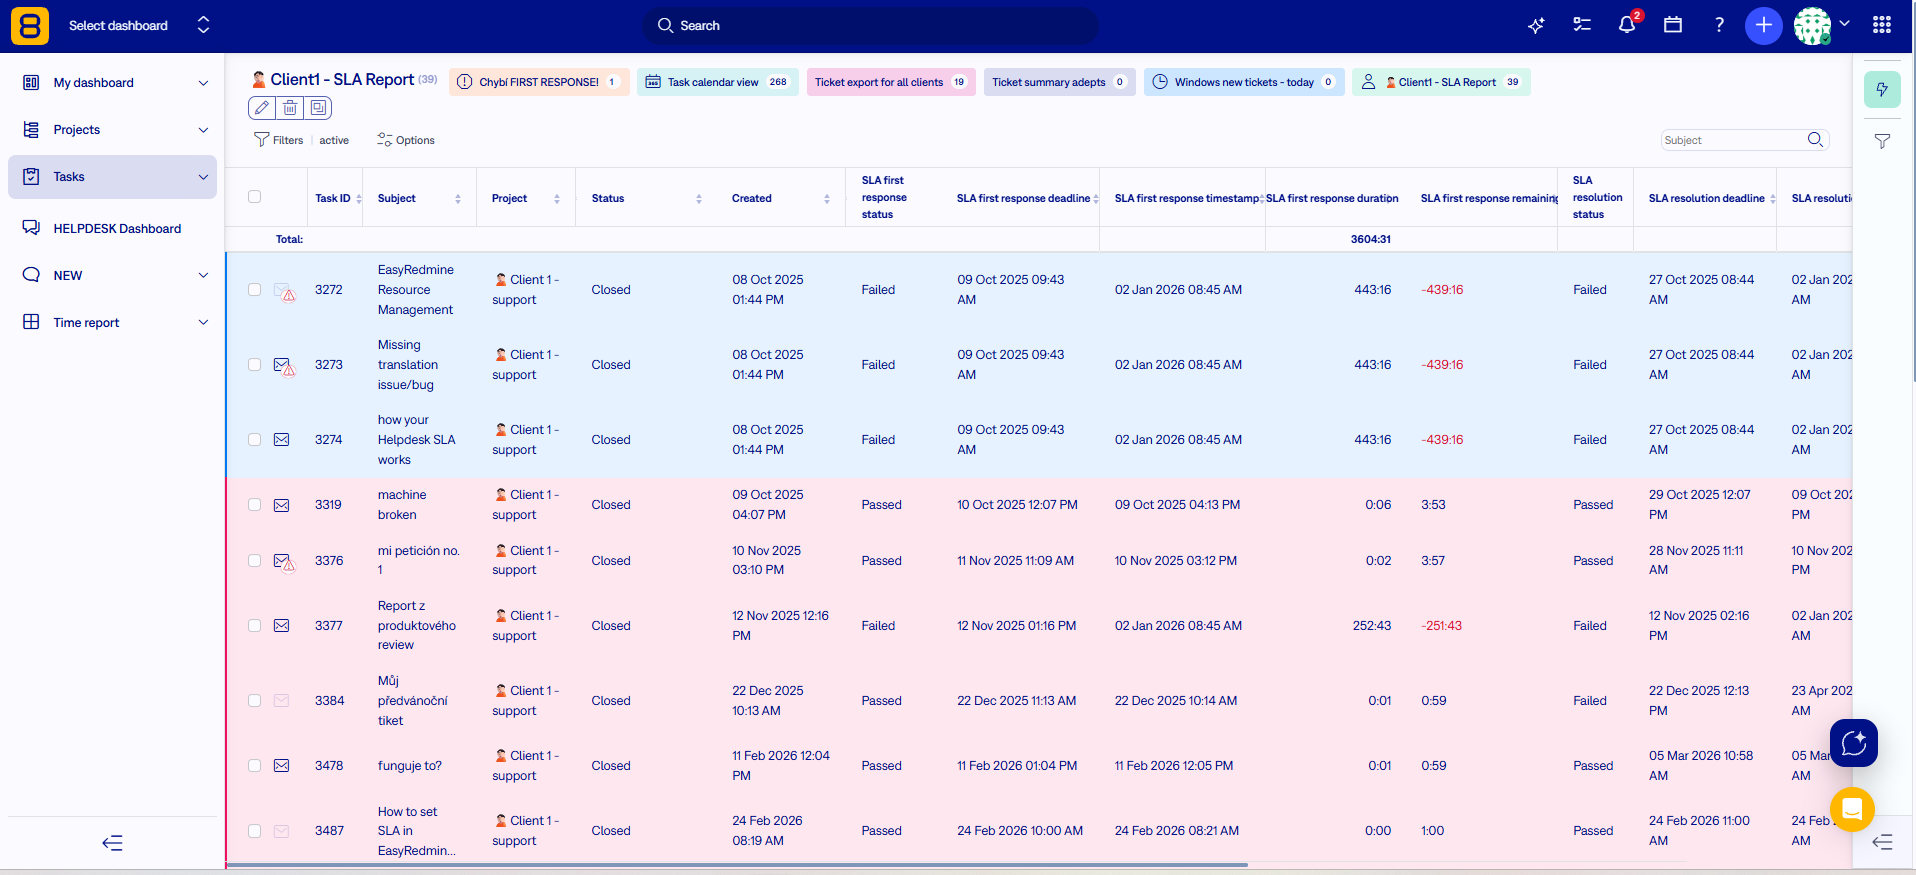
The same values are available as task list columns and filters, for example Has SLA, SLA first response timestamp, SLA first response overdue, SLA first response remaining time, SLA first response duration and their SLA resolution equivalents.
How to Build SLA Dashboards
Step 1: Add a widget based on tasks
- Open the dashboard where you want to track SLA performance and start editing it.
- Add a widget such as a list, graph or trend and select the Tasks entity.
Step 2: Apply the filters of the metric
- Pick a metric from the tables below.
- Set the filters listed for it. Always include Has SLA = yes.
- To report on a time period, add a date filter in the widget or use global filters on the dashboard.
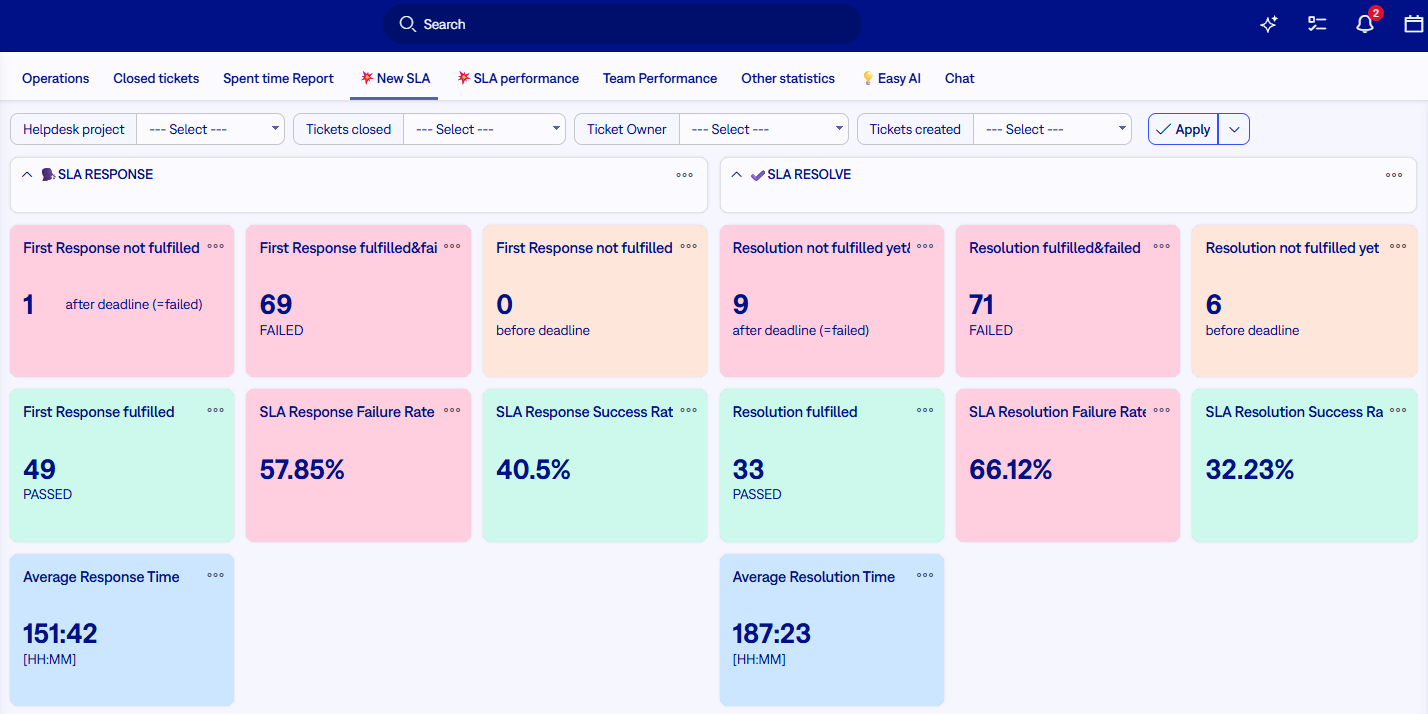
Step 3: Set up rates and averages in a trend widget
- For a rate, define value X and value Y with the filters listed and show X / Y as a percentage.
- For an average time, use the sum of durations as X and the number of tickets as Y.
Step 4: Export tickets for external reporting
- Open the task list with the filters of the metric you need.
- Add the SLA columns you want to report on and export the list.
First Response Metrics
| Metric | Filters | Notes |
|---|---|---|
| Not fulfilled yet, before deadline (number of tickets) | Has SLA = yes; SLA first response timestamp = is empty; SLA first response overdue = no | List, trend or graph |
| Not fulfilled yet, after deadline (number of tickets, failed in any case) | Has SLA = yes; SLA first response timestamp = is empty; SLA first response overdue = yes | List, trend or graph |
| Fulfilled, passed (number of tickets) | Has SLA = yes; SLA first response timestamp = is not empty or a time period; SLA first response overdue = no | SLA first response remaining time is positive |
| Fulfilled, failed (number of tickets) | Has SLA = yes; SLA first response timestamp = is not empty or a time period; SLA first response overdue = yes | SLA first response remaining time is negative |
| Response success rate (%) | X: Has SLA = yes; SLA first response overdue = no. Y: Has SLA = yes | Trend widget, X / Y as a percentage |
| Response failure rate (%) | X: Has SLA = yes; SLA first response overdue = yes. Y: Has SLA = yes | Trend widget, X / Y as a percentage |
| Average response time (hh:mm) | X: sum of SLA first response duration. Y: number of tickets. Both with Has SLA = yes; SLA first response timestamp = is not empty | Trend widget, X / Y |
Resolution Metrics
| Metric | Filters | Notes |
|---|---|---|
| Not fulfilled yet, before deadline (number of tickets) | Has SLA = yes; SLA resolution timestamp = is empty; SLA resolution overdue? = no | List, trend or graph |
| Not fulfilled yet, after deadline (number of tickets, failed in any case) | Has SLA = yes; SLA resolution timestamp = is empty; SLA resolution overdue? = yes | List, trend or graph |
| Fulfilled, passed (number of tickets) | Has SLA = yes; SLA resolution timestamp = is not empty or a time period; SLA resolution overdue? = no | SLA resolution remaining time is positive |
| Fulfilled, failed (number of tickets) | Has SLA = yes; SLA resolution timestamp = is not empty or a time period; SLA resolution overdue? = yes | SLA resolution remaining time is negative |
| Resolution success rate (%) | X: Has SLA = yes; SLA resolution overdue? = no. Y: Has SLA = yes | Trend widget, X / Y as a percentage |
| Resolution failure rate (%) | X: Has SLA = yes; SLA resolution overdue? = yes. Y: Has SLA = yes | Trend widget, X / Y as a percentage |
| Average resolution time (hh:mm) | X: sum of SLA resolution duration. Y: number of tickets. Both with Has SLA = yes; SLA resolution timestamp = is not empty | Trend widget, X / Y |
SLA Metrics Properties
- SLA first response remaining time and SLA resolution remaining time – calculated within business hours if they are set in the HelpDesk project.
- SLA response and SLA solution – auxiliary fields showing the absolute number of hours before or after the deadline, regardless of business hours. Use them only for open tickets. These counters never stop running.
- Most metrics do not consider the task status. To limit a metric to resolved tickets, add a status filter.
- Tickets created before SLA metrics were available in your application may not show these values.
- The fields SLA response fulfillment, SLA resolve fulfillment and First response are obsolete and will be removed. Do not use them in new dashboards or reports.
Troubleshooting
| Problem | Solution |
|---|---|
| A widget shows no tickets | Check that the widget uses the Tasks entity and the filter Has SLA = yes, and that SLA rules exist in the HelpDesk project. |
| Remaining time differs from the hours in the SLA rule | Remaining time respects business hours. Compare it with the working hours and calendar of the SLA rule. |
| Older tickets have no SLA values | Report on these tickets separately until they are closed. |
Conclusion
You can now track First Response and Resolution SLA performance on dashboards, calculate success rates and average times, and export tickets with SLA data for reporting outside Easy8.